XRP bearish trend persists despite key buy signal
- XRP remains largely in bearish hands amid a 2% intraday drawdown to $1.45.
- XRP faces a weak derivatives market as traders increasingly pile into bearish positions.
- The overall technical structure remains mostly bearish despite the MACD recently confirming a buy signal.

Ripple (XRP) edges lower at the time of writing on Tuesday, from the daily open of $1.48, as headwinds persist across the crypto market. A short-term support is emerging at $1.45, but a buildup of bearish positions could further weaken the derivatives market and prolong the correction.
Mixed outlook as XRP retail demand weakens
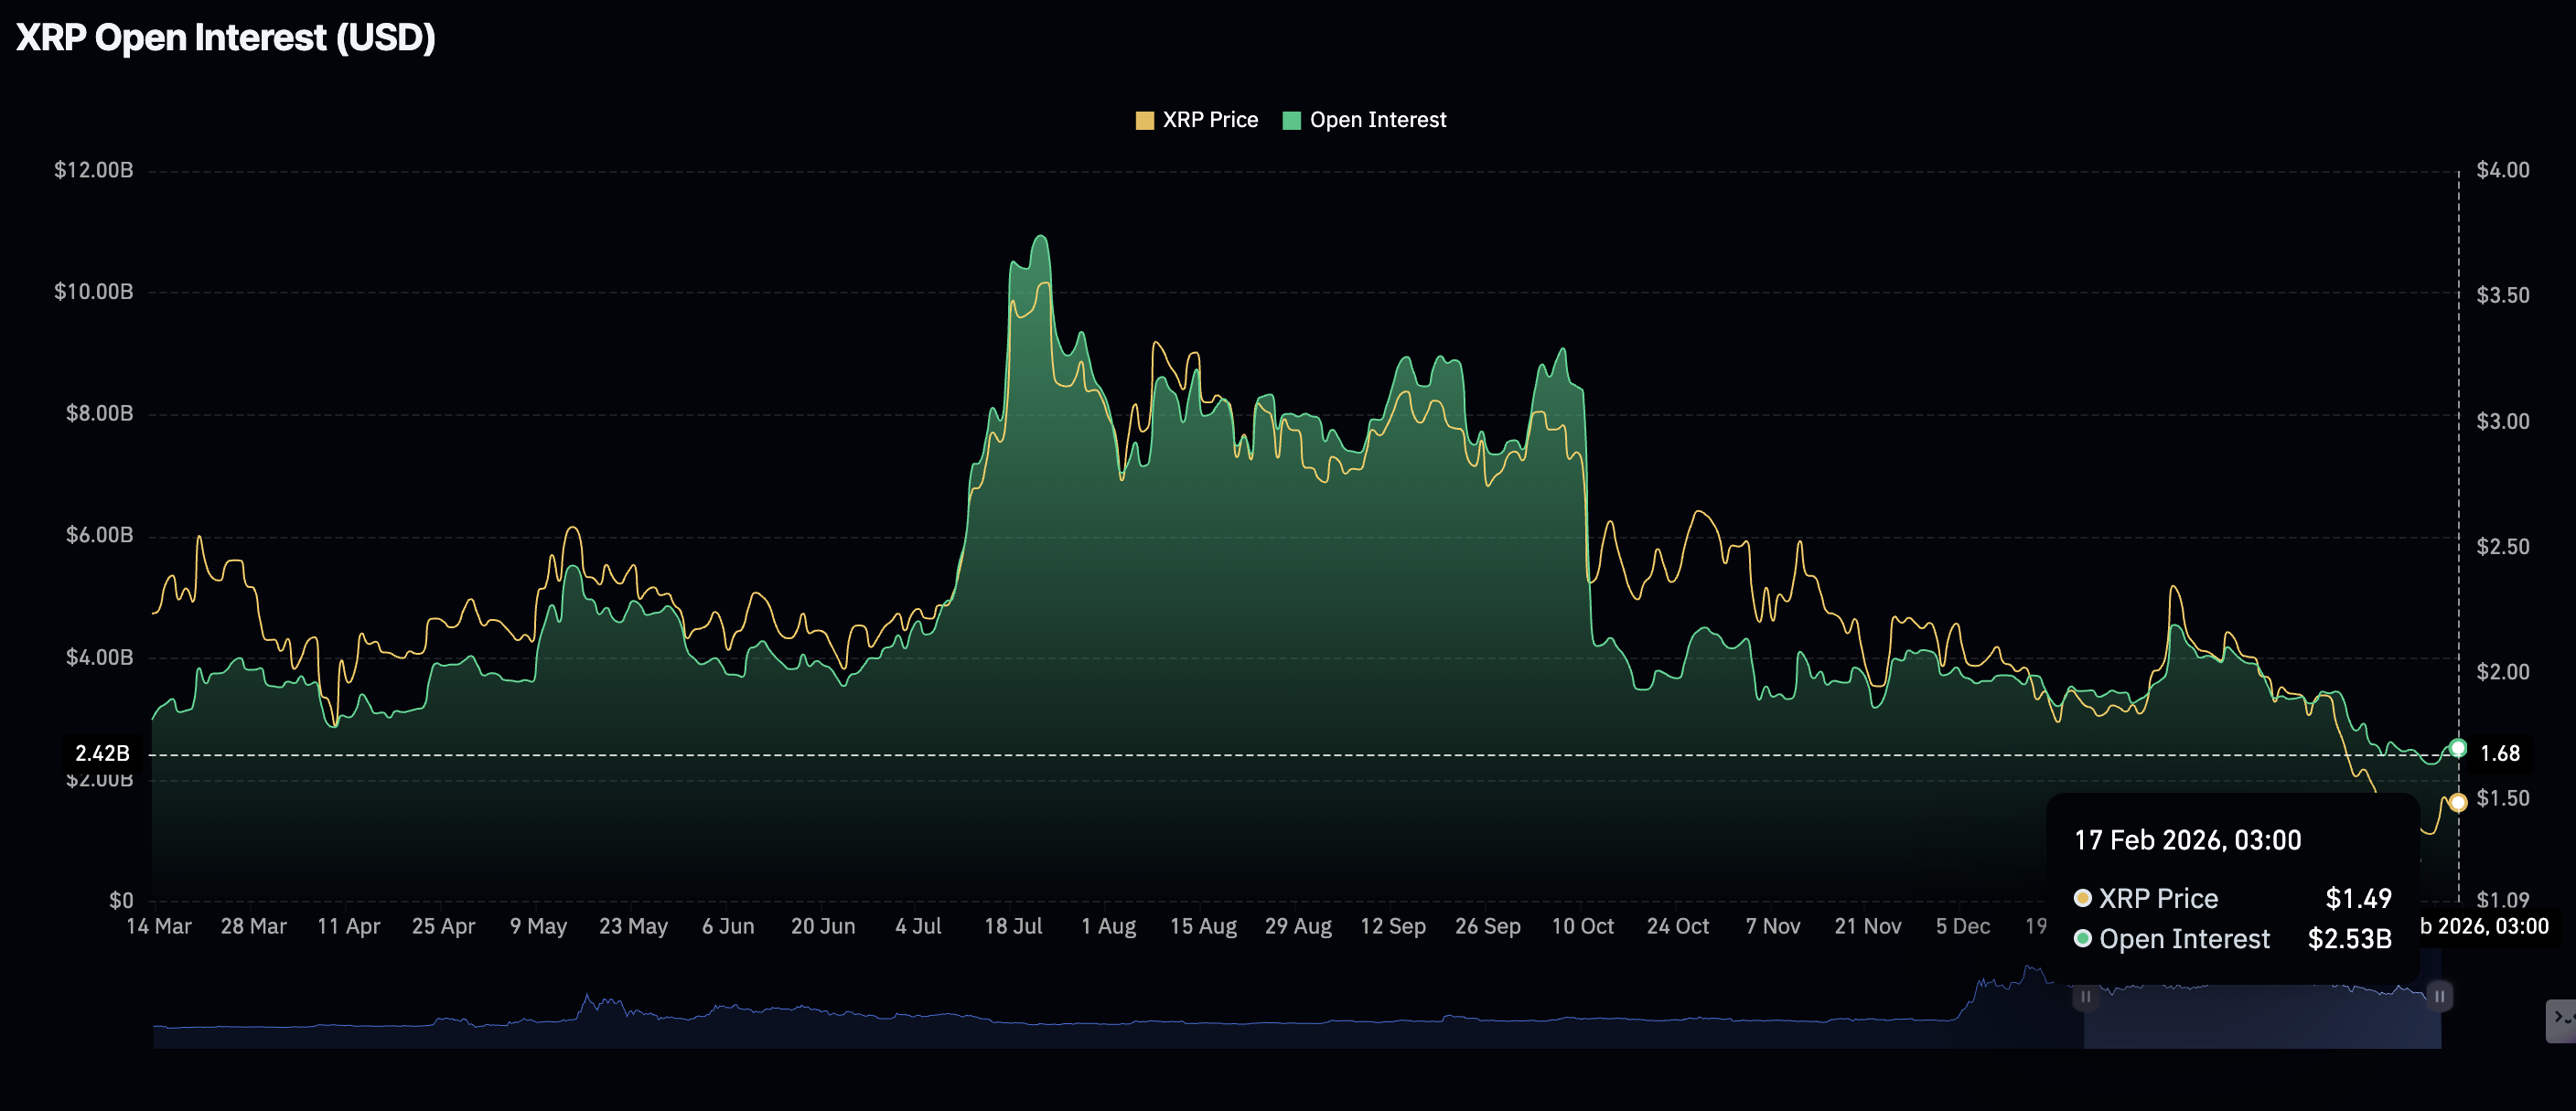
XRP is struggling to sustain its recovery, leading to volatile price fluctuations as retail interest wobbles. After the XRP futures Open Interest (OI) increased to $2.56 billion on Monday, it narrows to $2.53 billion on Tuesday, undermining last week’s optimism that propelled the price to $1.67 on Sunday.
OI remains significantly below the record high of $10.94 billion in July. As OI fades, traders close positions in droves and refuse to open new ones, leaving XRP vulnerable to market pressures and risk-off sentiment.
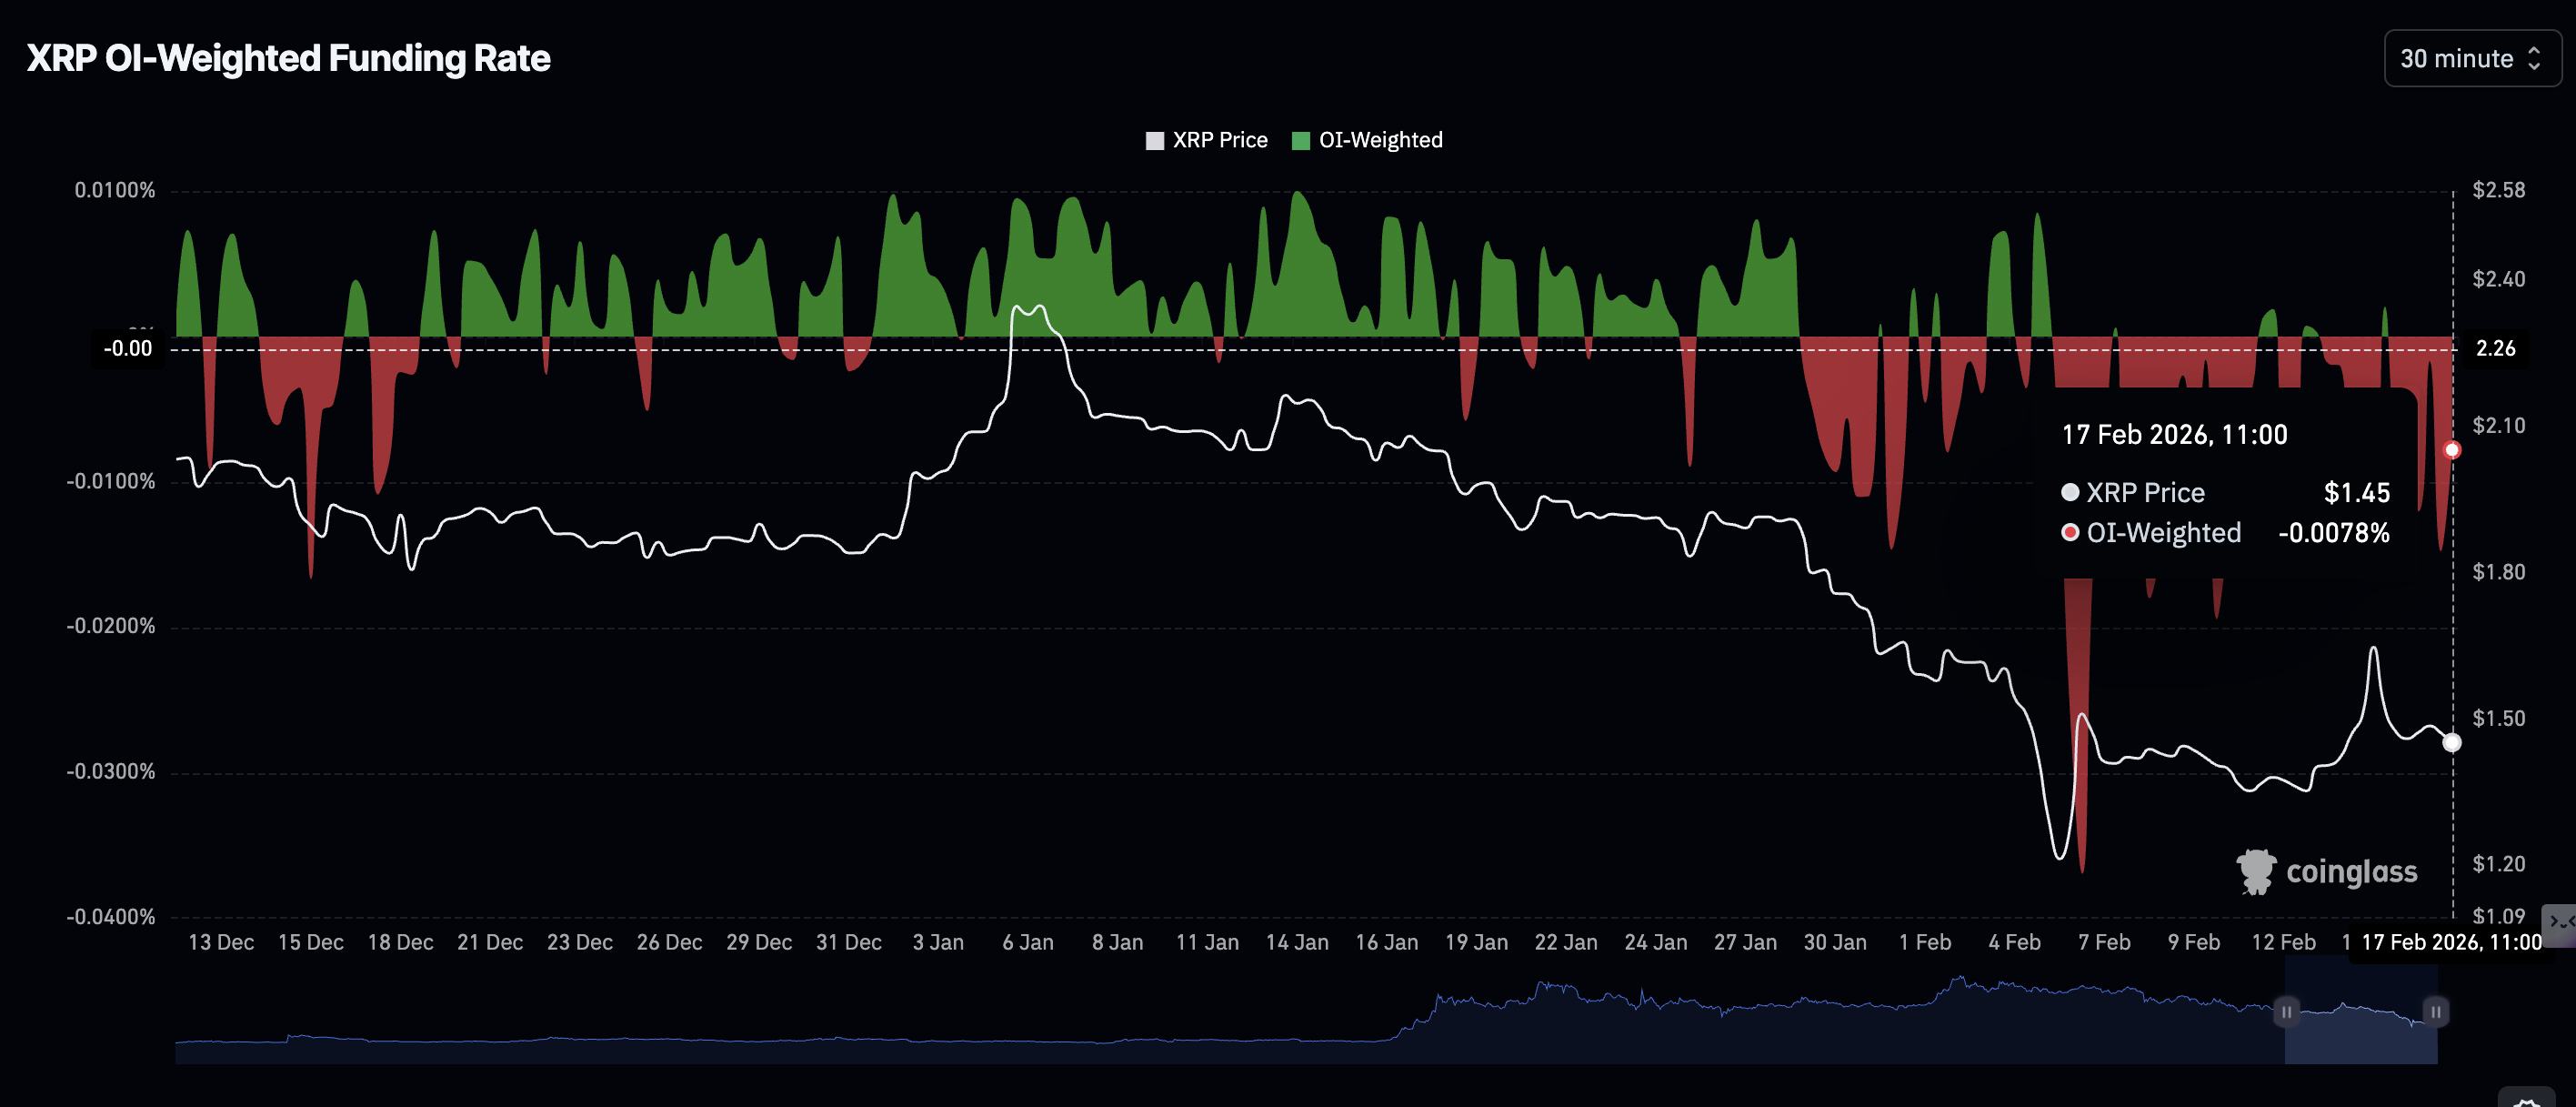
CoinGlass data shows that traders are increasingly piling into short positions, suggesting a lack of conviction in XRP’s short-term bullish outlook. The OI-Weighted Funding Rate holds at -0.0078% on Tuesday, remaining in the negative region since Sunday. Without follow-through momentum, price fluctuations will persist amid an overall bearish trend.
Technical outlook: Evaluating XRP market structure
XRP hovers above $1.45 while sitting well below the 50-day Exponential Moving Average (EMA) at $1.72, the 100-day EMA at $1.93 and the 200-day EMA at $2.13. All three moving averages are descending, confirming a deteriorating technical structure and increasing the odds of prolonging the ongoing correction.
Meanwhile, the Relative Strength Index (RSI) at 40.76 remains below the midline on the daily chart, tempering the upside despite a recent momentum shift when the Moving Average Convergence Divergence (MACD) crossed above its signal line on the same chart. The expanding green histogram bars may prompt traders to increase their exposure, especially if XRP defends a short-term support at $1.45, tested on Monday.
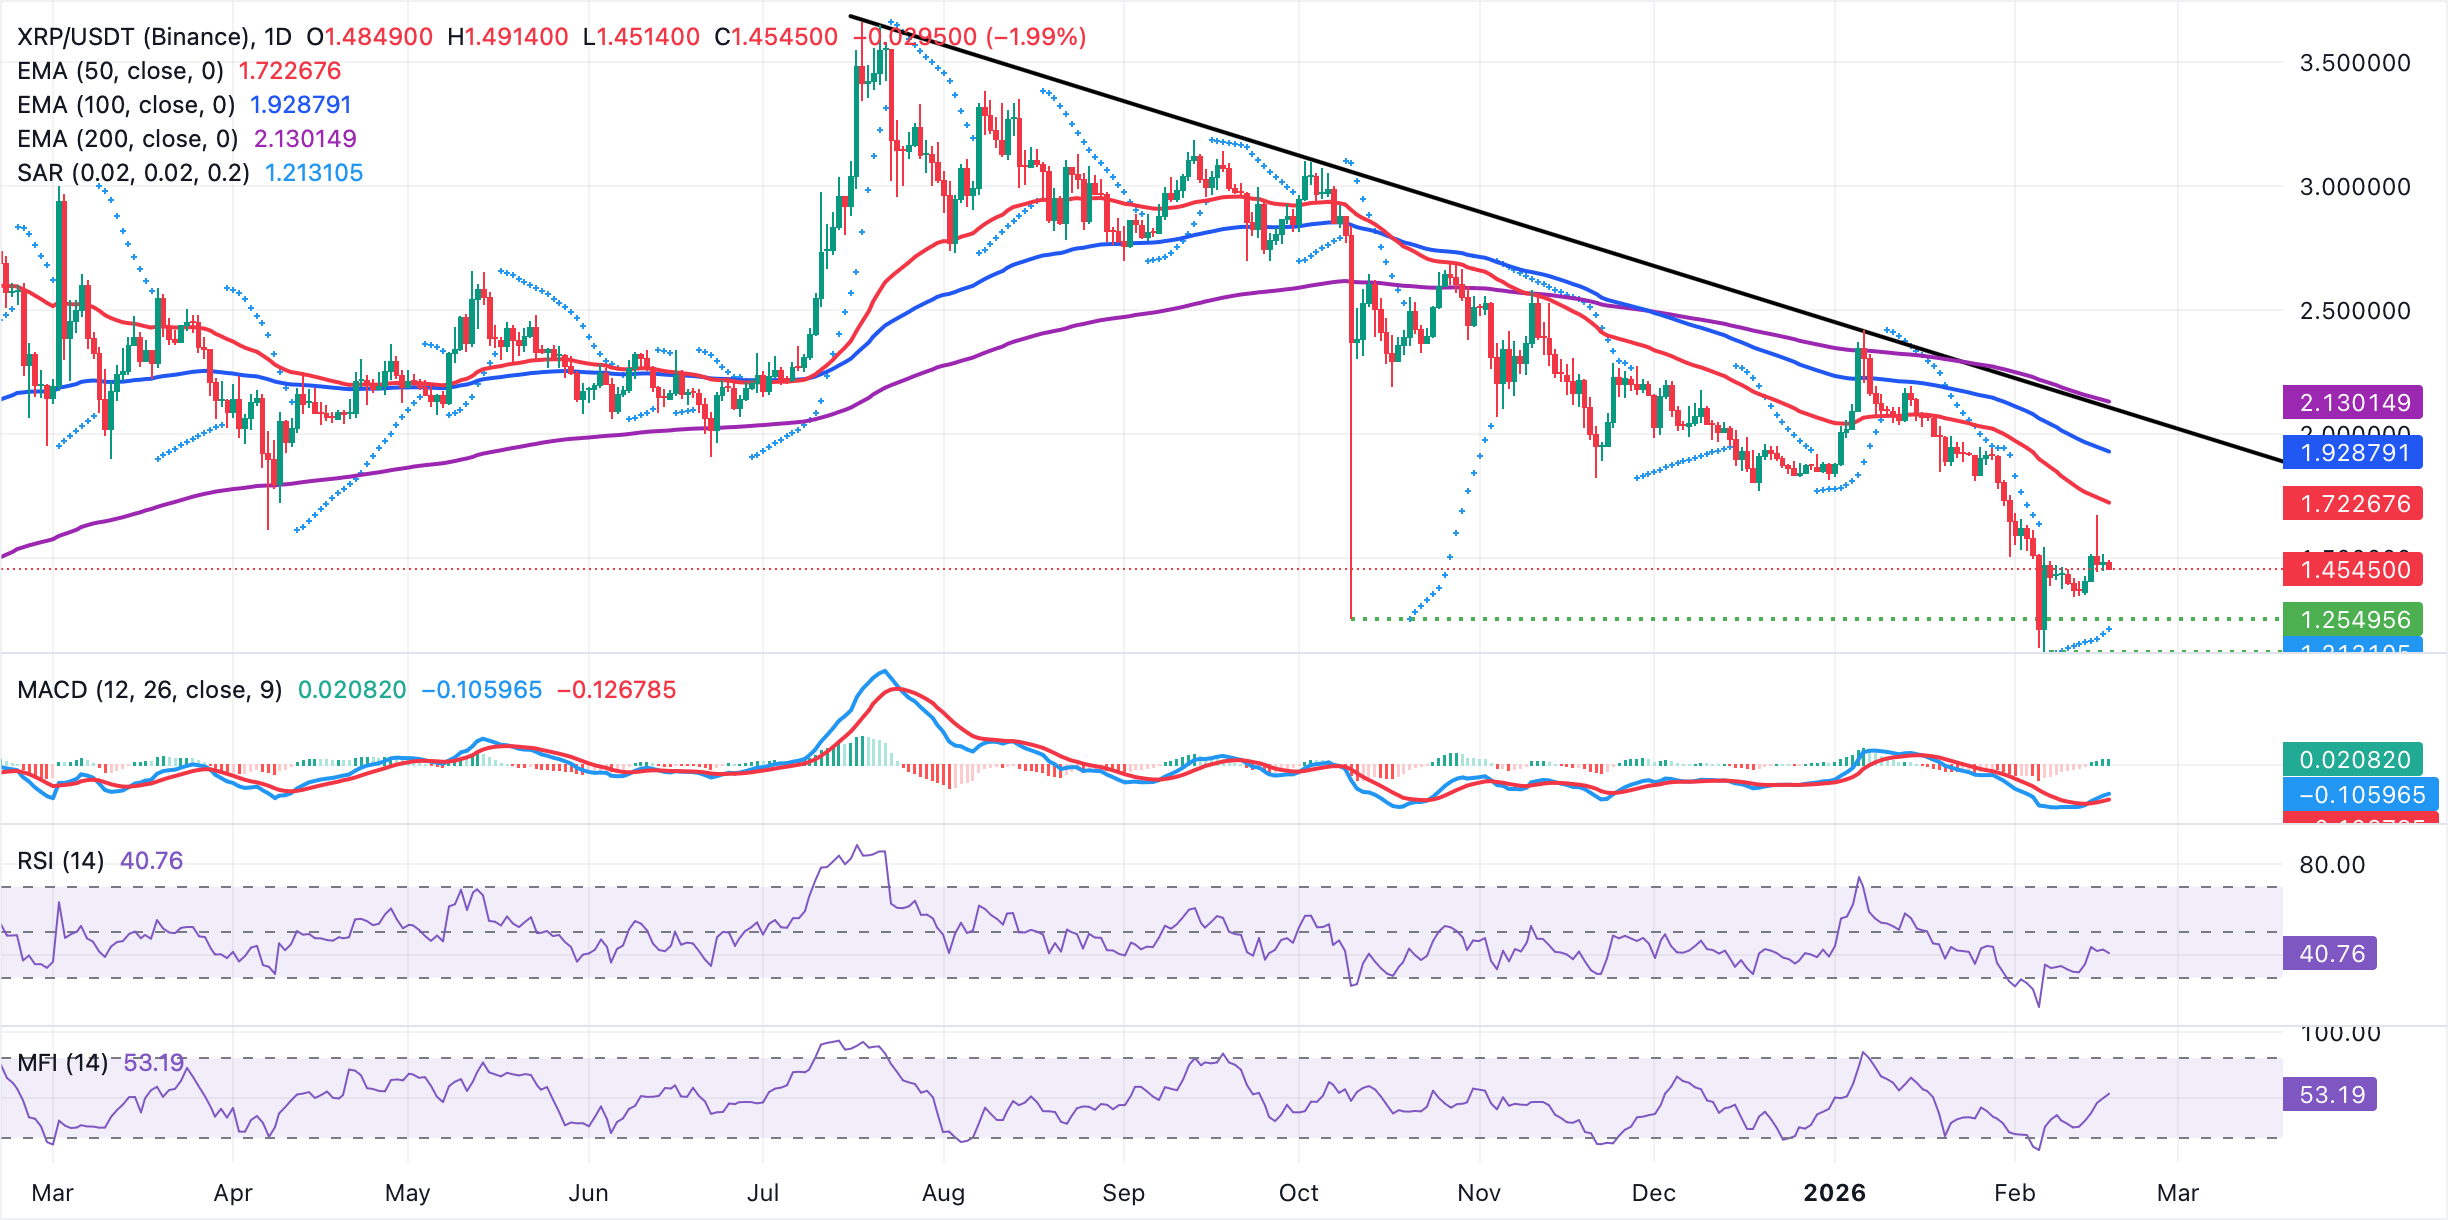
The descending trend line from $3.66 (record high) would limit gains, with resistance seen near $2.10. Moreover, the Parabolic SAR indicator trails below the price at $1.21, offering initial support that, if lost, could extend the bearish sequence. On the other hand, the improving MACD momentum would favor a push toward Sunday's high at $1.67.
Cryptocurrency metrics FAQs
The developer or creator of each cryptocurrency decides on the total number of tokens that can be minted or issued. Only a certain number of these assets can be minted by mining, staking or other mechanisms. This is defined by the algorithm of the underlying blockchain technology. On the other hand, circulating supply can also be decreased via actions such as burning tokens, or mistakenly sending assets to addresses of other incompatible blockchains.
Market capitalization is the result of multiplying the circulating supply of a certain asset by the asset’s current market value.
Trading volume refers to the total number of tokens for a specific asset that has been transacted or exchanged between buyers and sellers within set trading hours, for example, 24 hours. It is used to gauge market sentiment, this metric combines all volumes on centralized exchanges and decentralized exchanges. Increasing trading volume often denotes the demand for a certain asset as more people are buying and selling the cryptocurrency.
Funding rates are a concept designed to encourage traders to take positions and ensure perpetual contract prices match spot markets. It defines a mechanism by exchanges to ensure that future prices and index prices periodic payments regularly converge. When the funding rate is positive, the price of the perpetual contract is higher than the mark price. This means traders who are bullish and have opened long positions pay traders who are in short positions. On the other hand, a negative funding rate means perpetual prices are below the mark price, and hence traders with short positions pay traders who have opened long positions.
(The technical analysis of this story was written with the help of an AI tool.)
Author

John Isige
FXStreet
John Isige is a seasoned cryptocurrency journalist and markets analyst committed to delivering high-quality, actionable insights tailored to traders, investors, and crypto enthusiasts. He enjoys deep dives into emerging Web3 tren



