Crypto Today: Bitcoin, Ethereum, XRP upside looks limited amid deteriorating retail demand
- Bitcoin extends its sideways price action in the upper $ 60,000's, with support at $67,000 holding.
- Ethereum extends its recent consolidation amid mixed signals, with futures Open Interest plateauing around $23 billion.
- XRP upside looks capped under $1.50 despite the MACD indicator sending a buy signal.

The cryptocurrency market extends weakness with major coins including Bitcoin (BTC), Ethereum (ETH) and Ripple (XRP) trading in sideways price action at the time of writing on Tuesday.
Bitcoin holds above support at $67,000 after attempts to push above $70,000 stalled, highlighting a persistently weak derivatives market. Meanwhile, Ethereum remains in a narrow range, with support around $1,937 and resistance in the lower $ 2,000s. XRP, on the other hand, tests Monday's low at $1.45 amid mixed market signals.
Weak derivatives weigh as Bitcoin, Ethereum, XRP trade sideways
Bitcoin's 46% drop from its record high of $126,199 has kept most retail traders on the sidelines. Moreover, weak rebounds lack follow-through momentum amid extended risk-off sentiment.
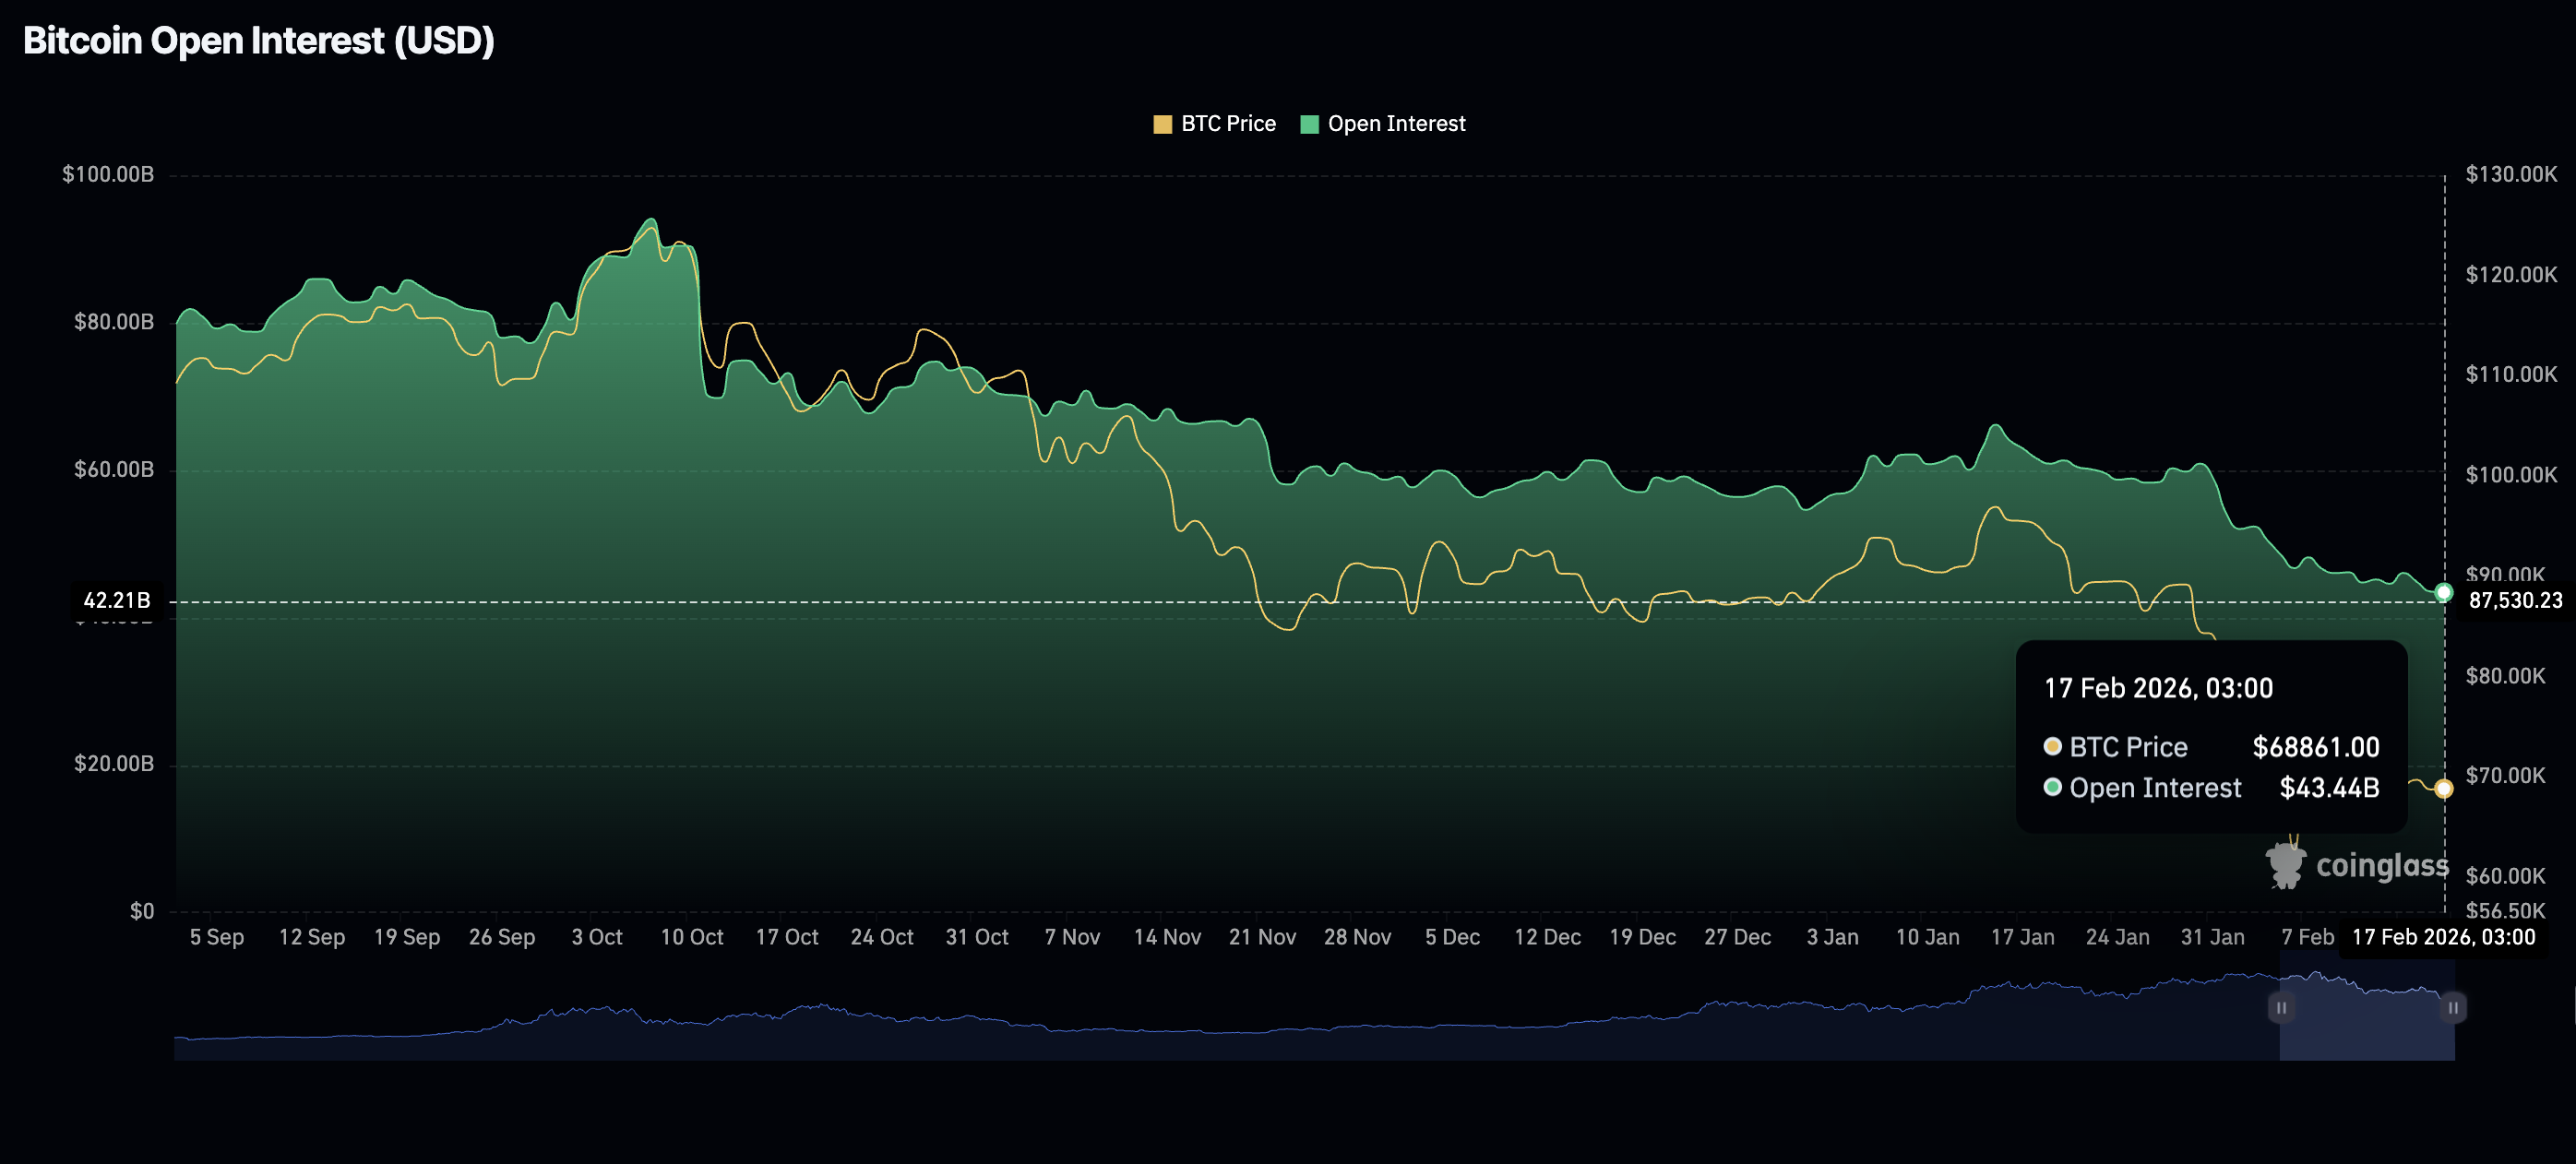
The drawdown in interest is evident in the significant decline in futures Open Interest (OI), which averages $43.44 billion on Tuesday, down slightly from $43.55 billion the previous day. OI peaked at $94.12 billion in October, contributing to Bitcoin's robust uptrend toward new all-time highs.
A persistent weakness in futures OI suggests that investors are less confident in Bitcoin's ability to sustain its recovery, which could explain the adamant refusal to increase exposure.
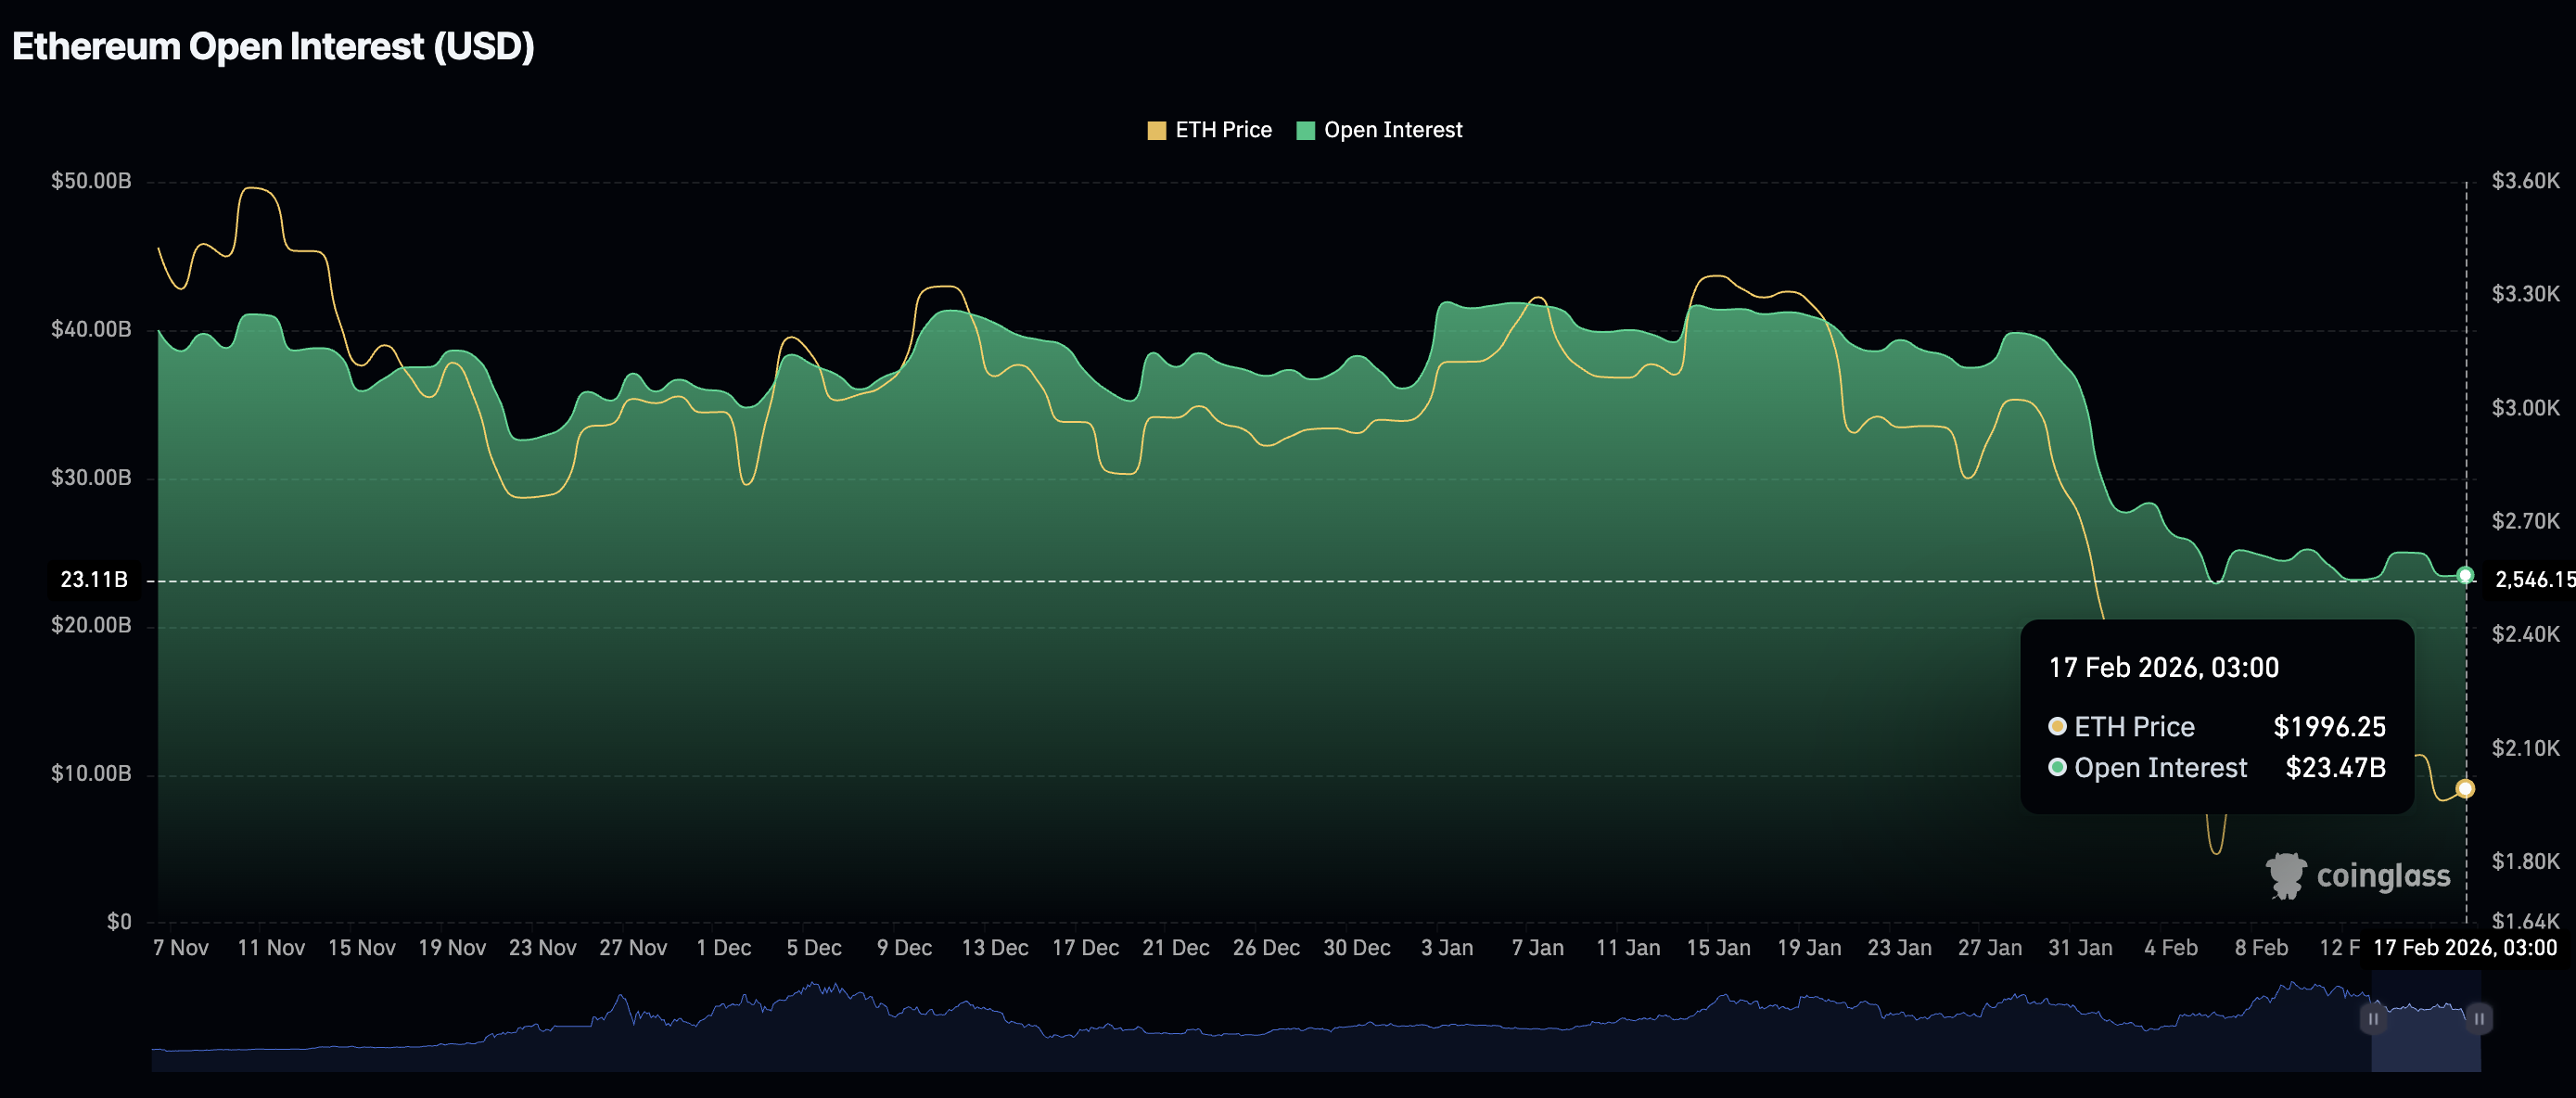
Ethereum exhibits a similar weak-derivatives structure to Bitcoin, as futures OI stabilises around $23.47 billion on Tuesday, according to CoinGlass data. Since ETH hit a historical high of $4,956 in August, retail investors have significantly reduced exposure, as futures OI peaked at $70.13 billion at that time. A further decline in OI would weigh on Ethereum, limiting its upside, while increasing the odds of an extended downtrend.
Meanwhile, the XRP derivatives market signals potential stability at lower levels of $2.53 billion on Tuesday. The futures OI averaged $2.56 billion on Monday, underpinning the trader interest in the remittance token. Extended stability could boost risk appetite and support a steady price increase.
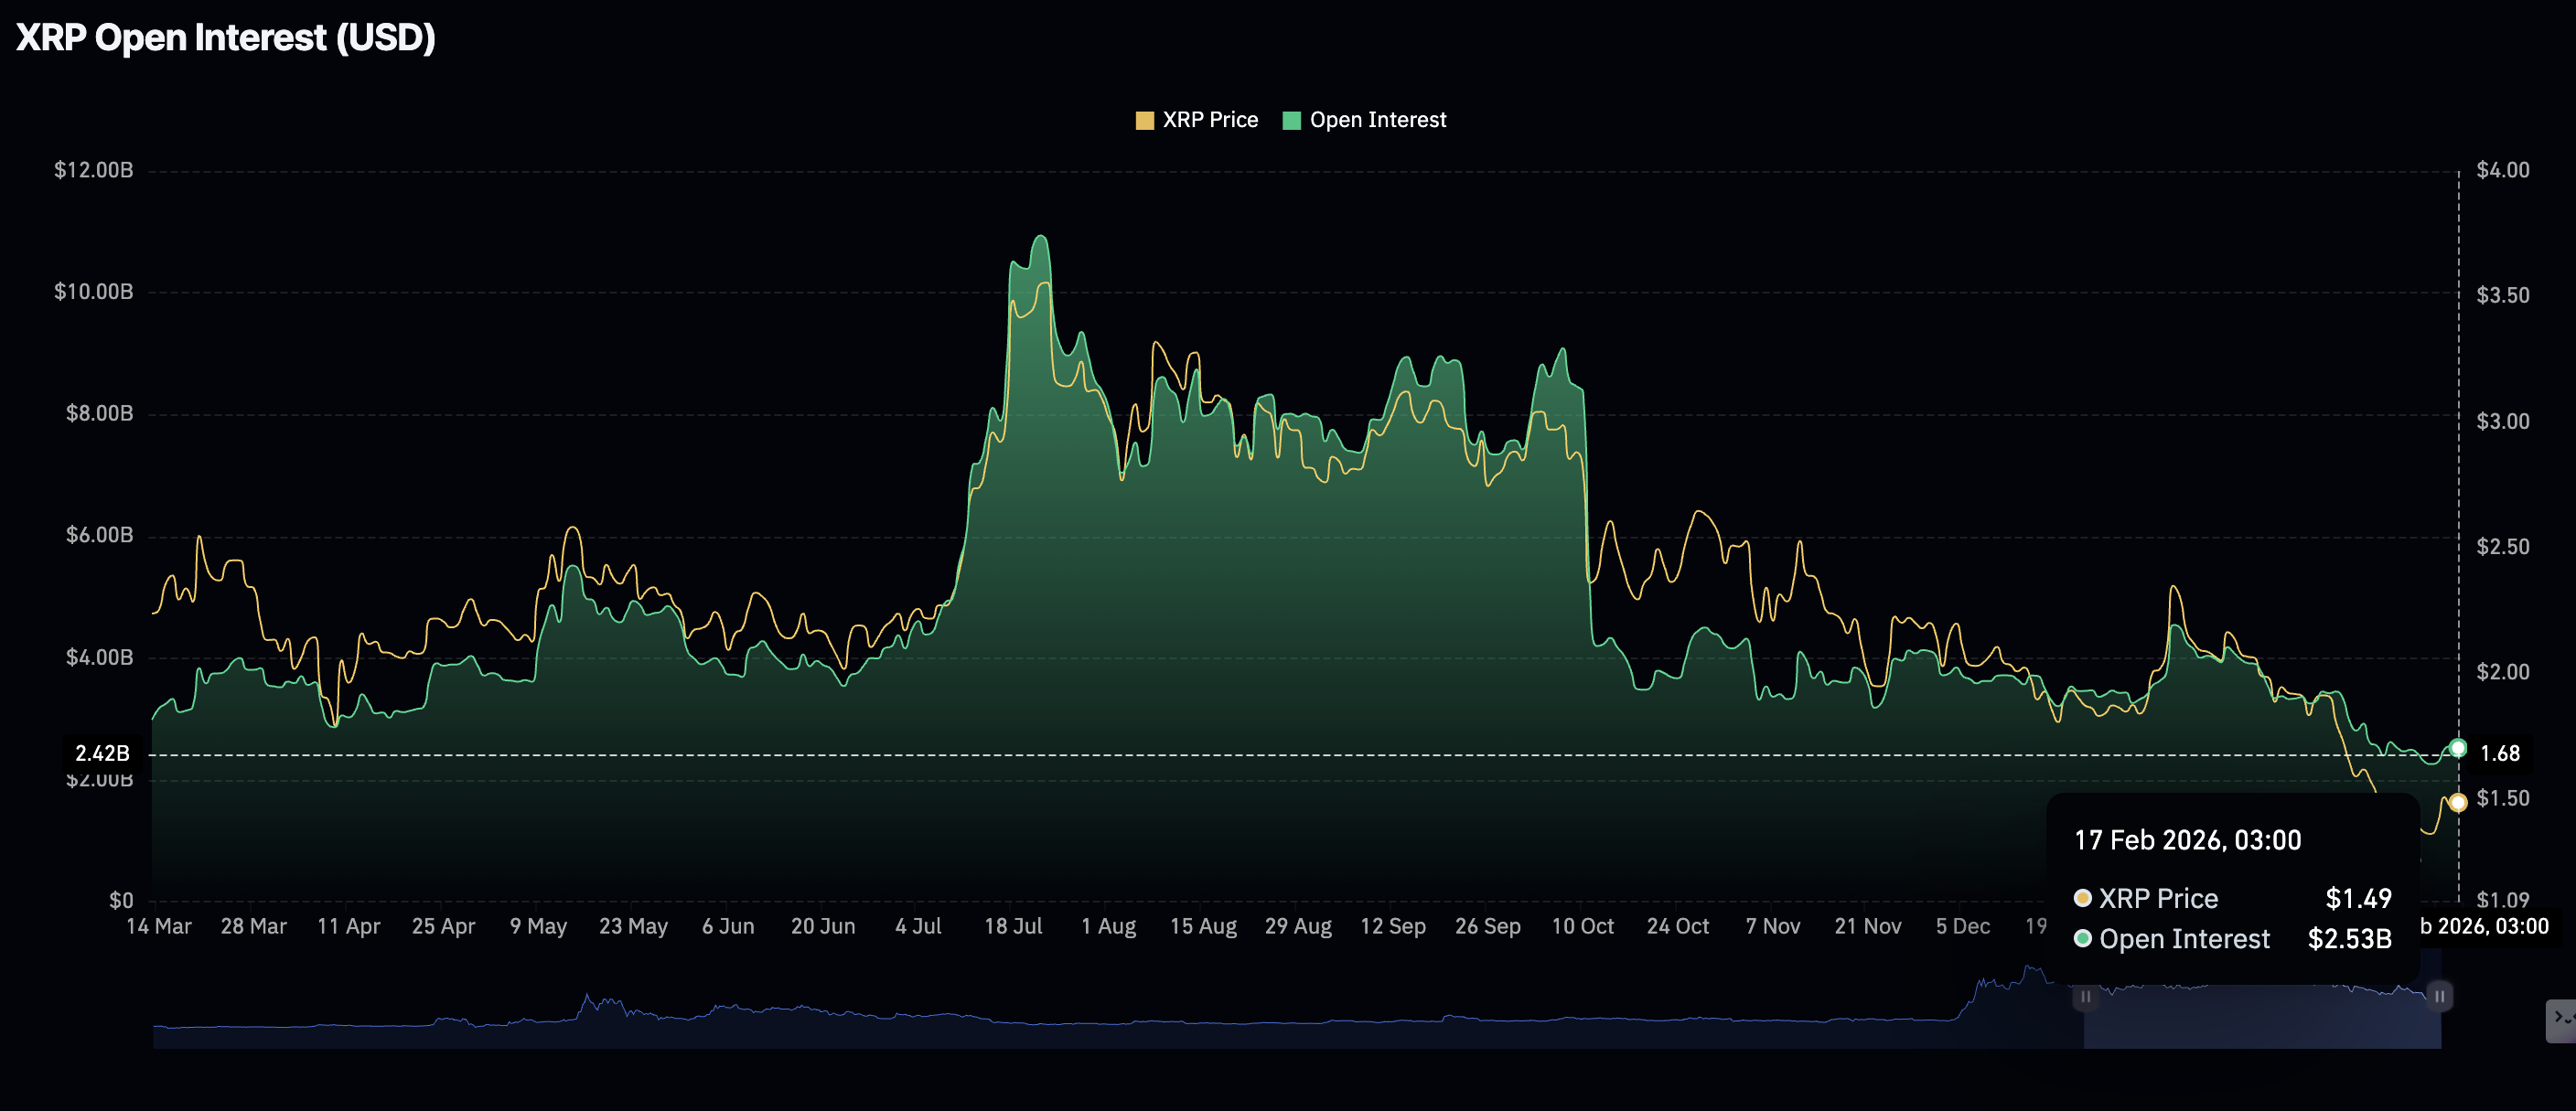
Chart of the day: Bitcoin at risk of extending losses
Bitcoin hovers slightly above $68,000 after last week's rebound weakened around the $70,000 threshold. Its position below the downward-sloping 50-day Exponential Moving Average (EMA) at $80,219, the 100-day EMA at $87,105 and the 200-day EMA at $93,629 hints at a deteriorating technical structure.
A daily close below the immediate $68,000 support could accelerate the decline toward Monday's low at $67,294 and the potential demand zone tested at $65,118 on Thursday.
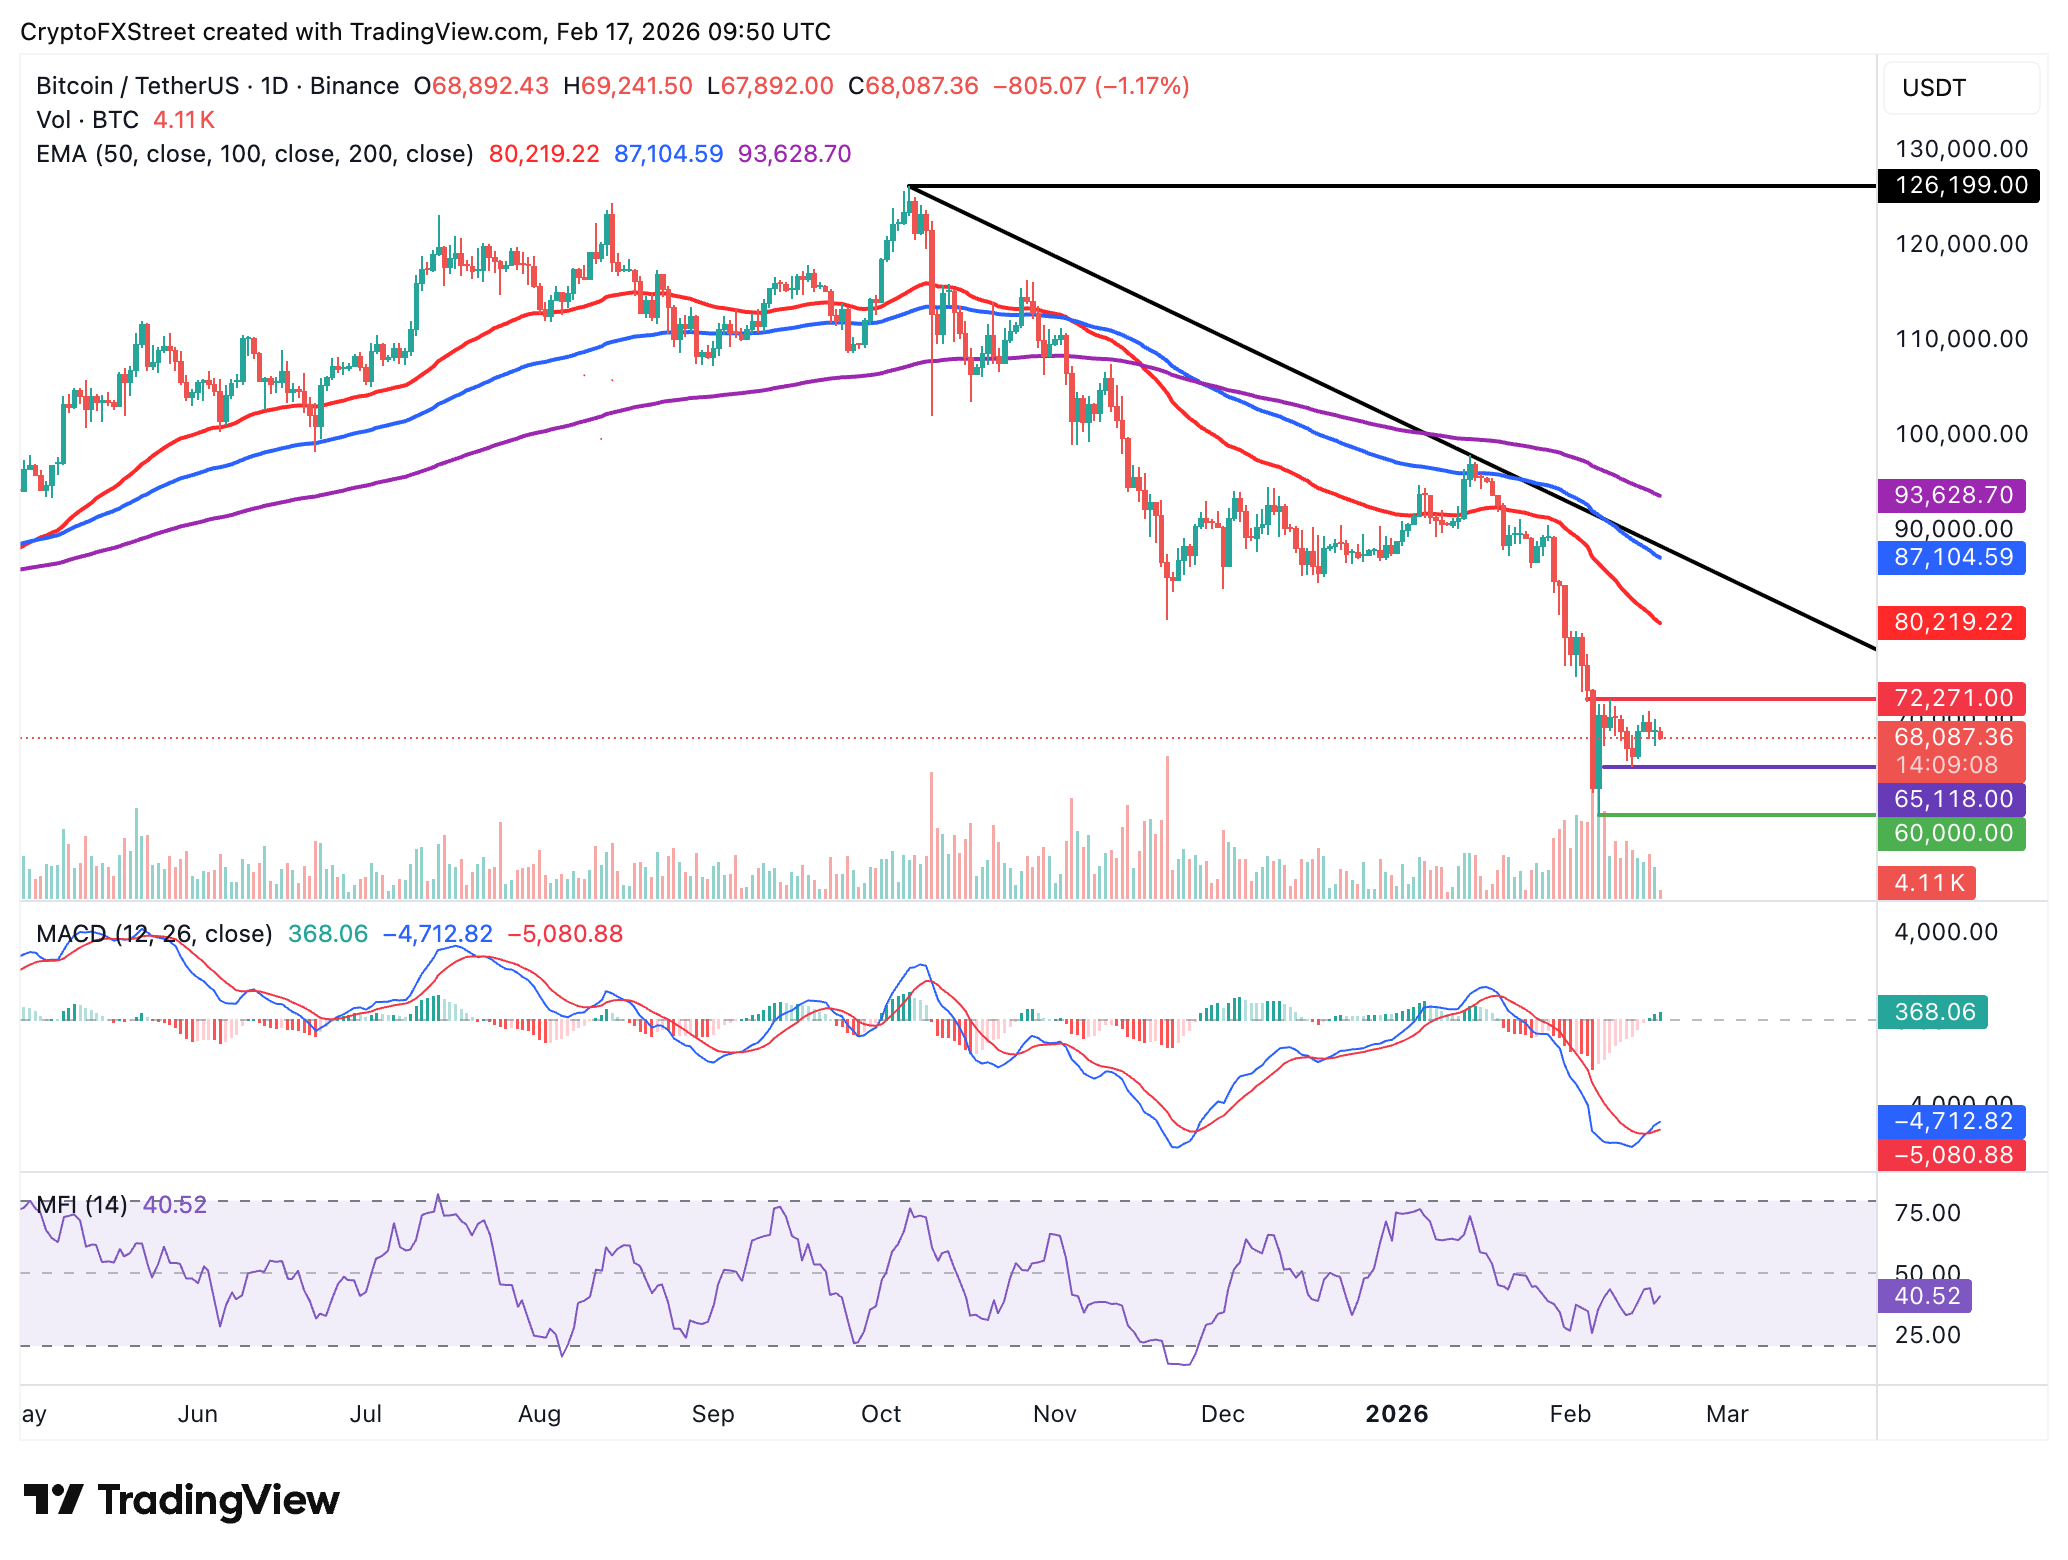
Conversely, the Moving Average Convergence Divergence (MACD) indicator holds above the signal line on the daily chart, prompting investors to buy BTC. The green histogram bars are expanding above the zero line, supporting risk-on sentiment.
The Money Flow Index (MFI) on the same chart sits at 40, rebounding from 37 on Monday, and hinting at a growing bullish bias. Breaching resistance at $70,000 may open the door to a stronger uptrend, targeting the February 8 high at $72,271.
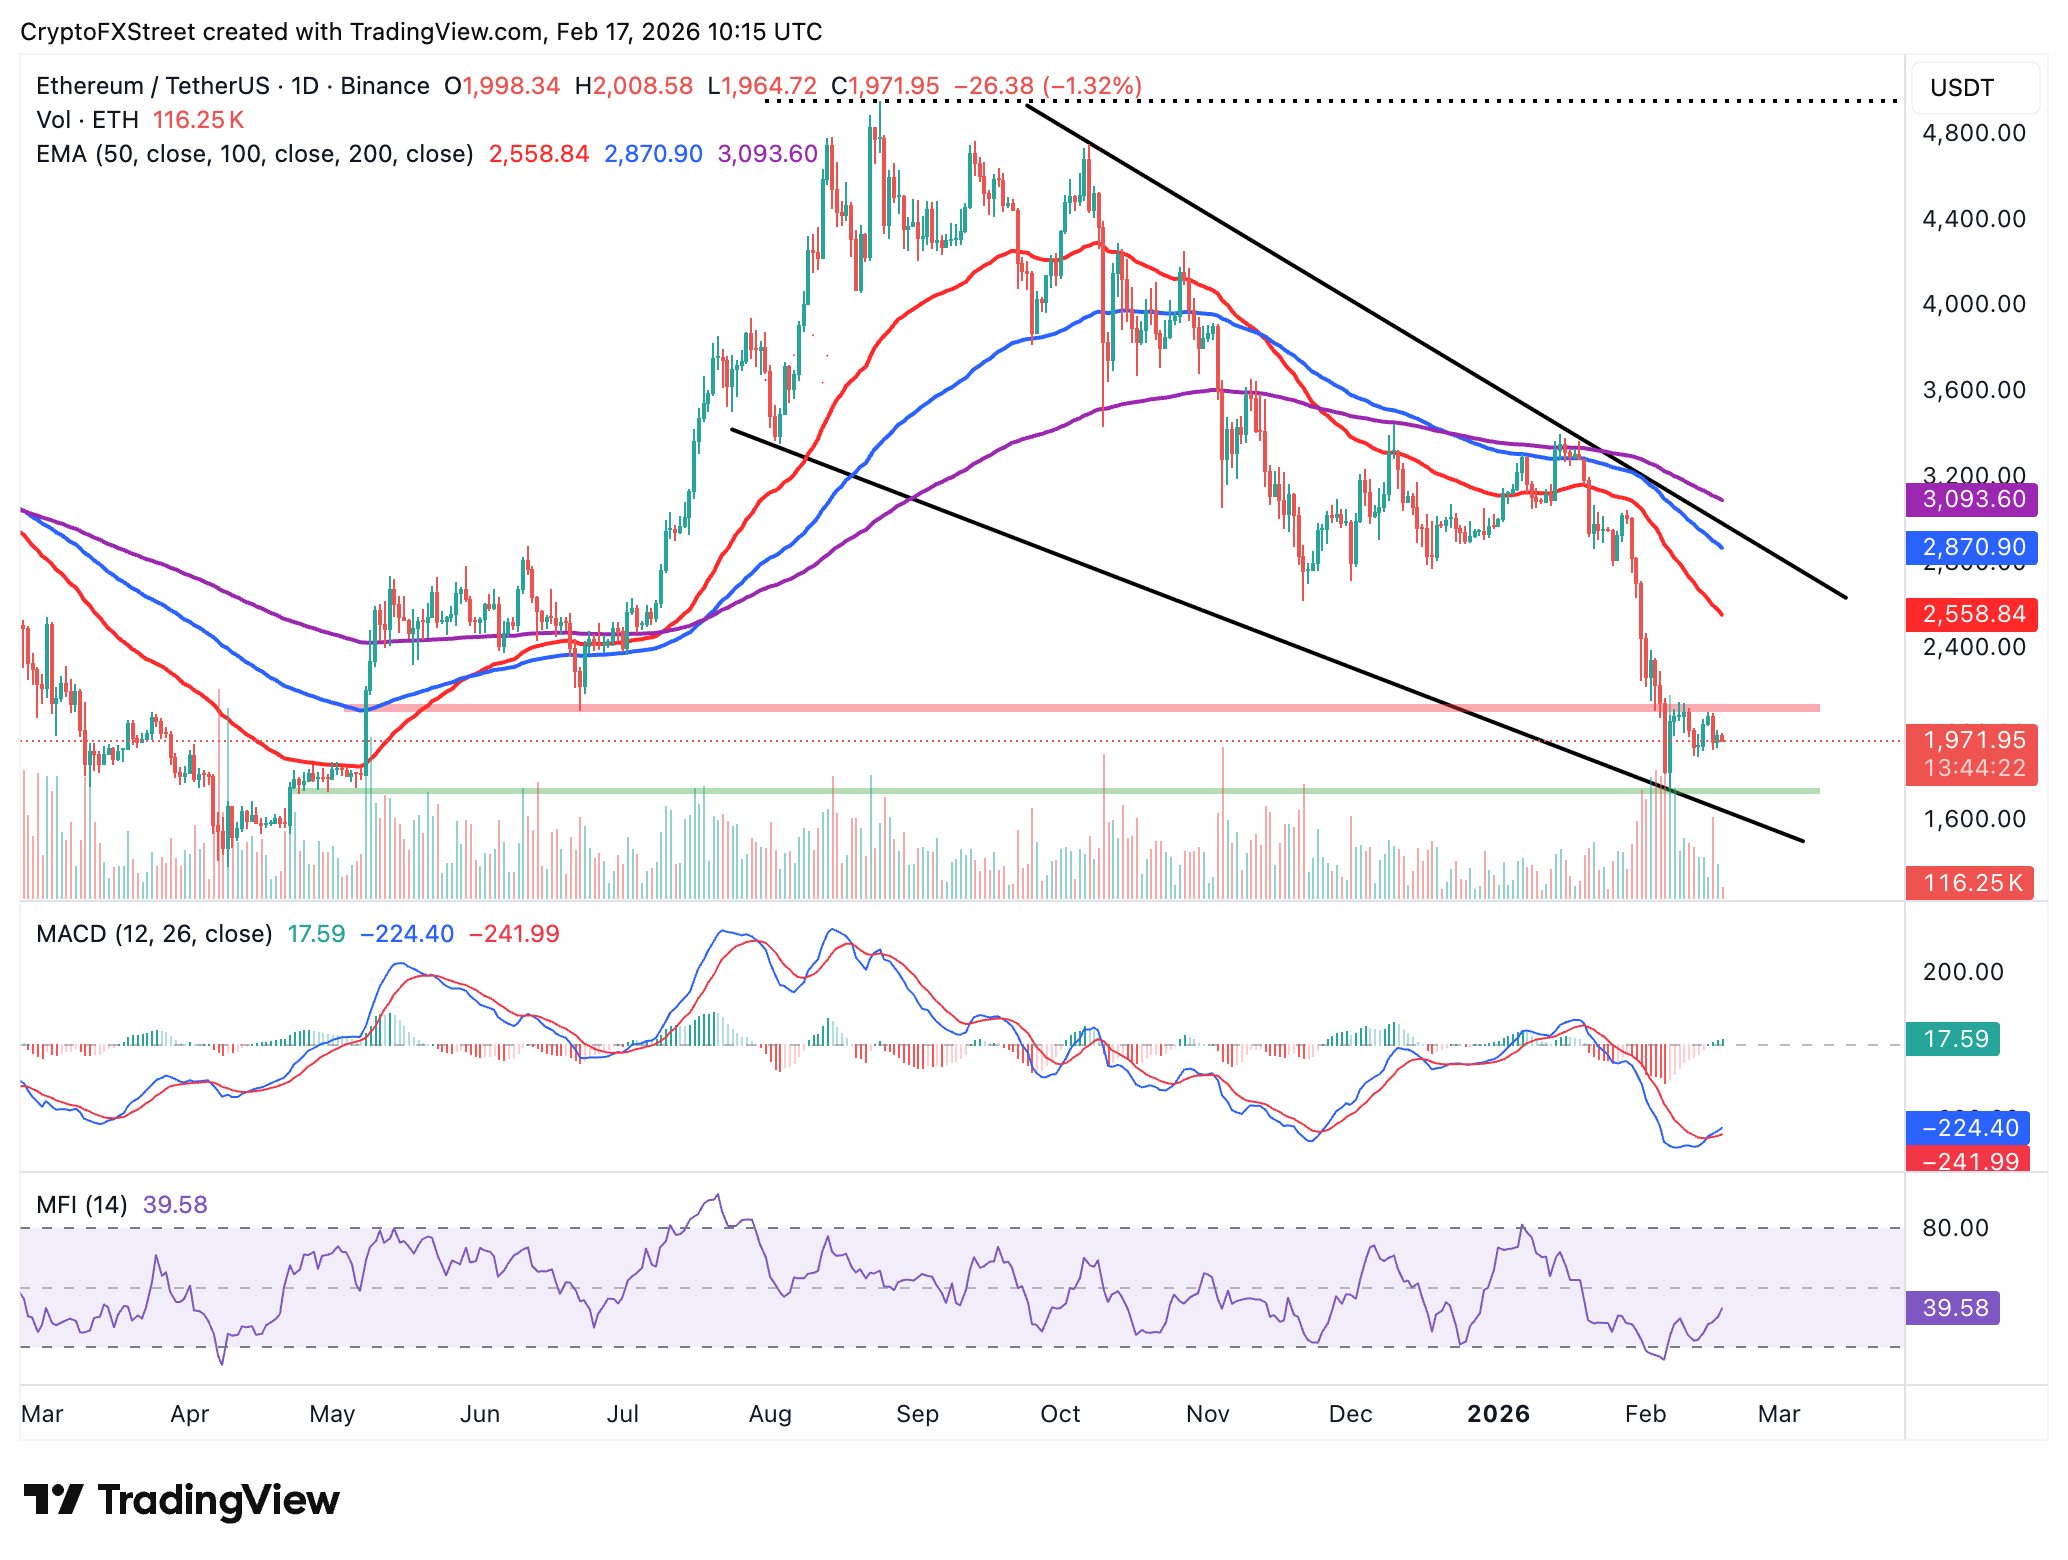
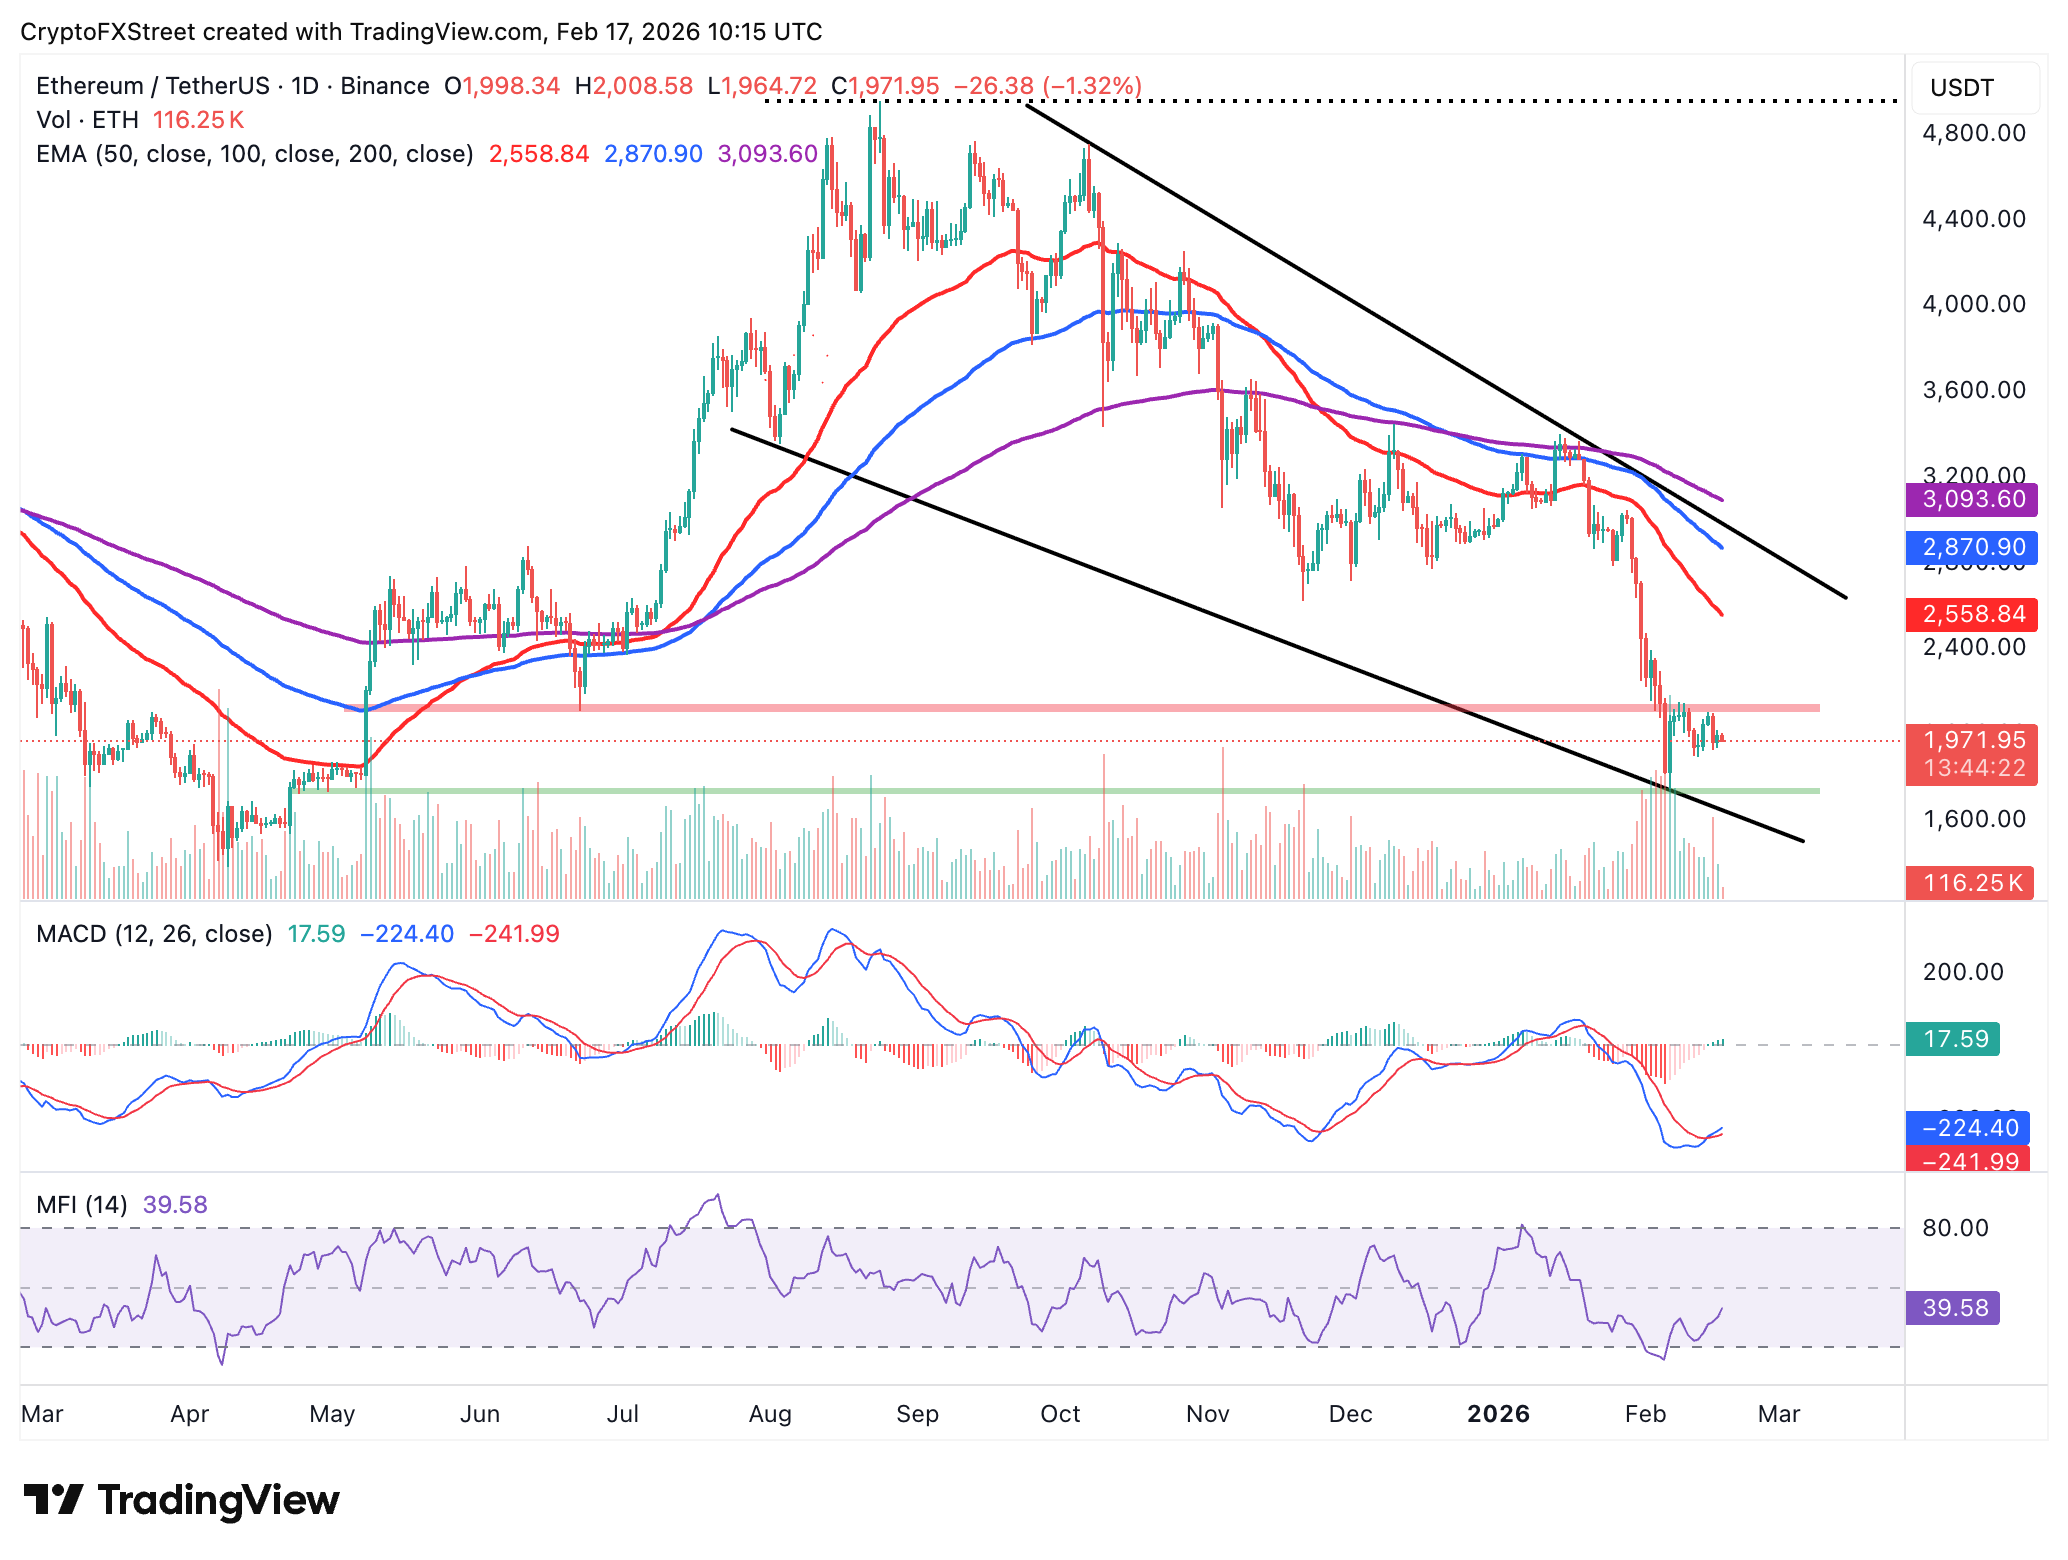
Ethereum sits between $1,937 and $2,023, Monday's low and high respectively, highlighting an unresolved tug-of-war between the bulls and the bears. Despite narrow sideways trading, ETH remains bearish, with intraday losses exceeding 1%.
The sharp decline in the 50-day EMA at $2,559, the 100-day EMA at $2,871 and the 200-day EMA at $3,094 align with a deteriorating technical structure. If ETH slides below Monday's low at $1,937, sellers could tighten their grip, as the odds of an extended decline to the $1,747 support level would increase.
However, the MACD indicator remains above its signal line on the daily chart, suggesting bullish momentum could prevail. If traders interpret the expanding green histogram bars as a signal to increase exposure, a steady price increase could propel ETH above $2,000.
Meanwhile, XRP faces intensifying headwinds, trading at $1.45 at the time of writing on Tuesday. Before the ongoing correction, the remittance token had recovered to $1.67 on Sunday, aligning with the aforementioned weak retail interest.
The 50-day EMA at $1.72, the 100-day EMA at $1.93 and the 200-day EMA at $2.14 are sloping downward, confirming the overall bearish momentum weighing on XRP.
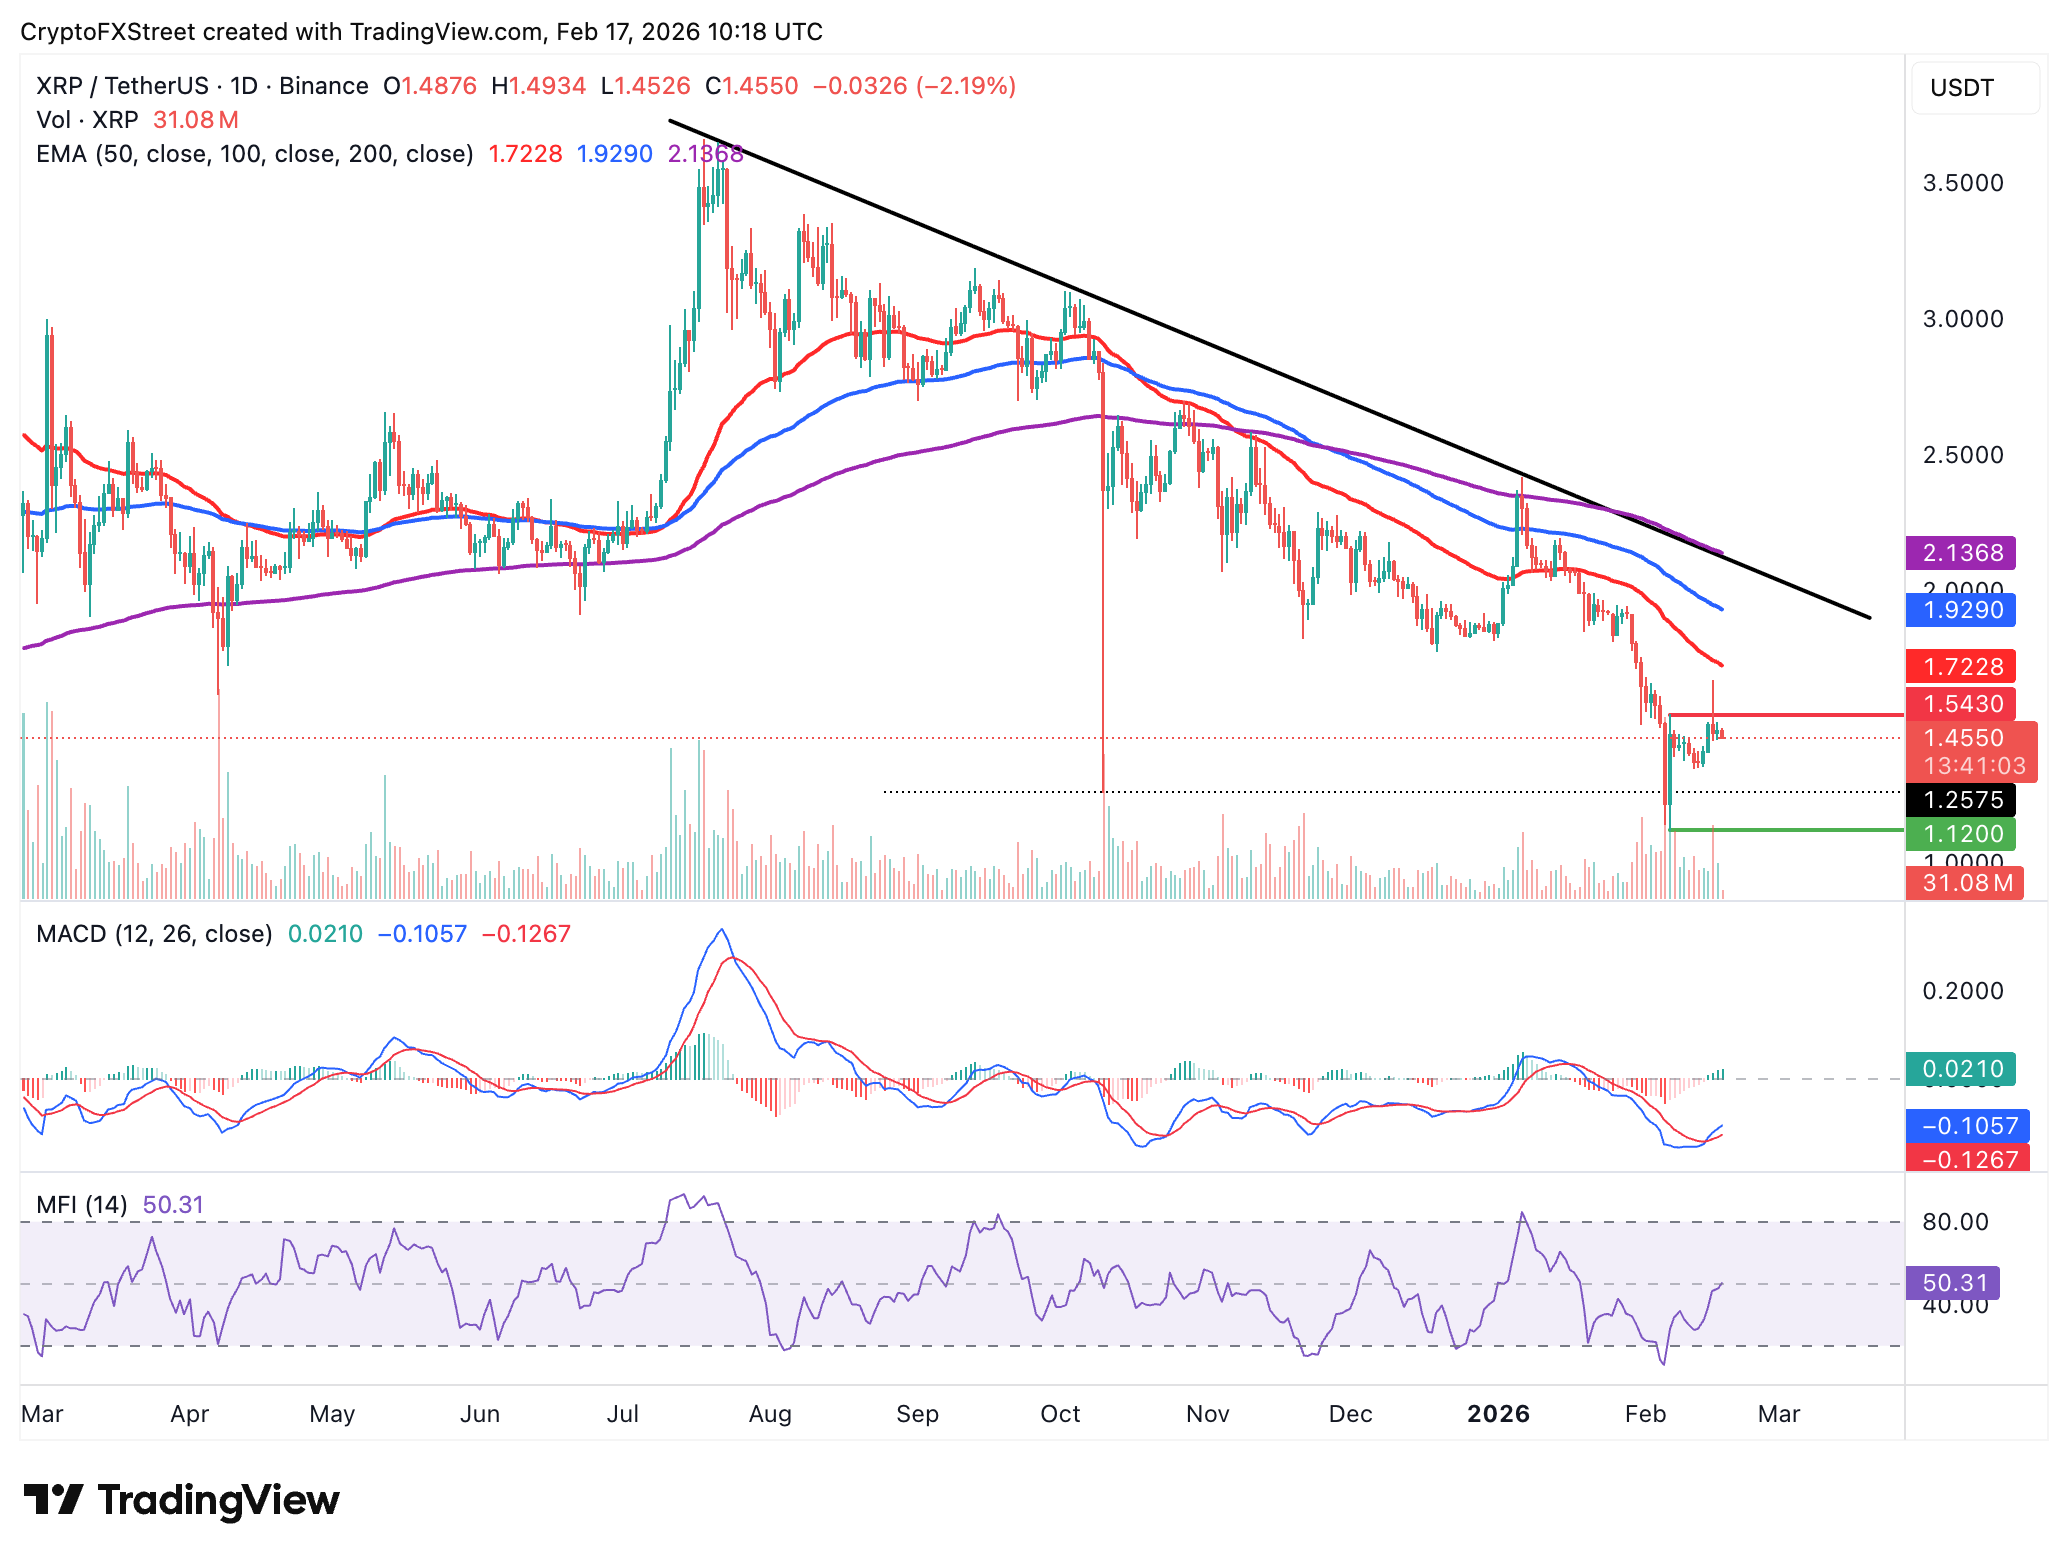
Despite the MACD indicator holding above the signal line on the daily chart and the green histogram bars expanding, investors do not appear convinced that XRP can sustain an uptrend. Still, the MFI indicator has crossed above the 50 midline, suggesting that more money is flowing into XRP, which could boost its recovery potential.
A decisive break above the seller congestion around $1.50 would help shape XRP's short-term bullish outlook and increase the chances of a breakout toward Sunday's high at $1.67.
Cryptocurrency prices FAQs
Token launches influence demand and adoption among market participants. Listings on crypto exchanges deepen the liquidity for an asset and add new participants to an asset’s network. This is typically bullish for a digital asset.
A hack is an event in which an attacker captures a large volume of the asset from a DeFi bridge or hot wallet of an exchange or any other crypto platform via exploits, bugs or other methods. The exploiter then transfers these tokens out of the exchange platforms to ultimately sell or swap the assets for other cryptocurrencies or stablecoins. Such events often involve an en masse panic triggering a sell-off in the affected assets.
Macroeconomic events like the US Federal Reserve’s decision on interest rates influence crypto assets mainly through the direct impact they have on the US Dollar. An increase in interest rate typically negatively influences Bitcoin and altcoin prices, and vice versa. If the US Dollar index declines, risk assets and associated leverage for trading gets cheaper, in turn driving crypto prices higher.
Halvings are typically considered bullish events as they slash the block reward in half for miners, constricting the supply of the asset. At consistent demand if the supply reduces, the asset’s price climbs.
Author

John Isige
FXStreet
John Isige is a seasoned cryptocurrency journalist and markets analyst committed to delivering high-quality, actionable insights tailored to traders, investors, and crypto enthusiasts. He enjoys deep dives into emerging Web3 tren




