S&P 500 (ES, SPY) Technical Forecast: Three reasons to worry about the rally, VIX, delta and RSI
- S&P 500 snoozes through Tuesday's session as big tech goes on strike.
- Market entering the strongest period historically for equities, the first half of July.
- Crypto stocks take over from big tech and meme as the hot names of the day.

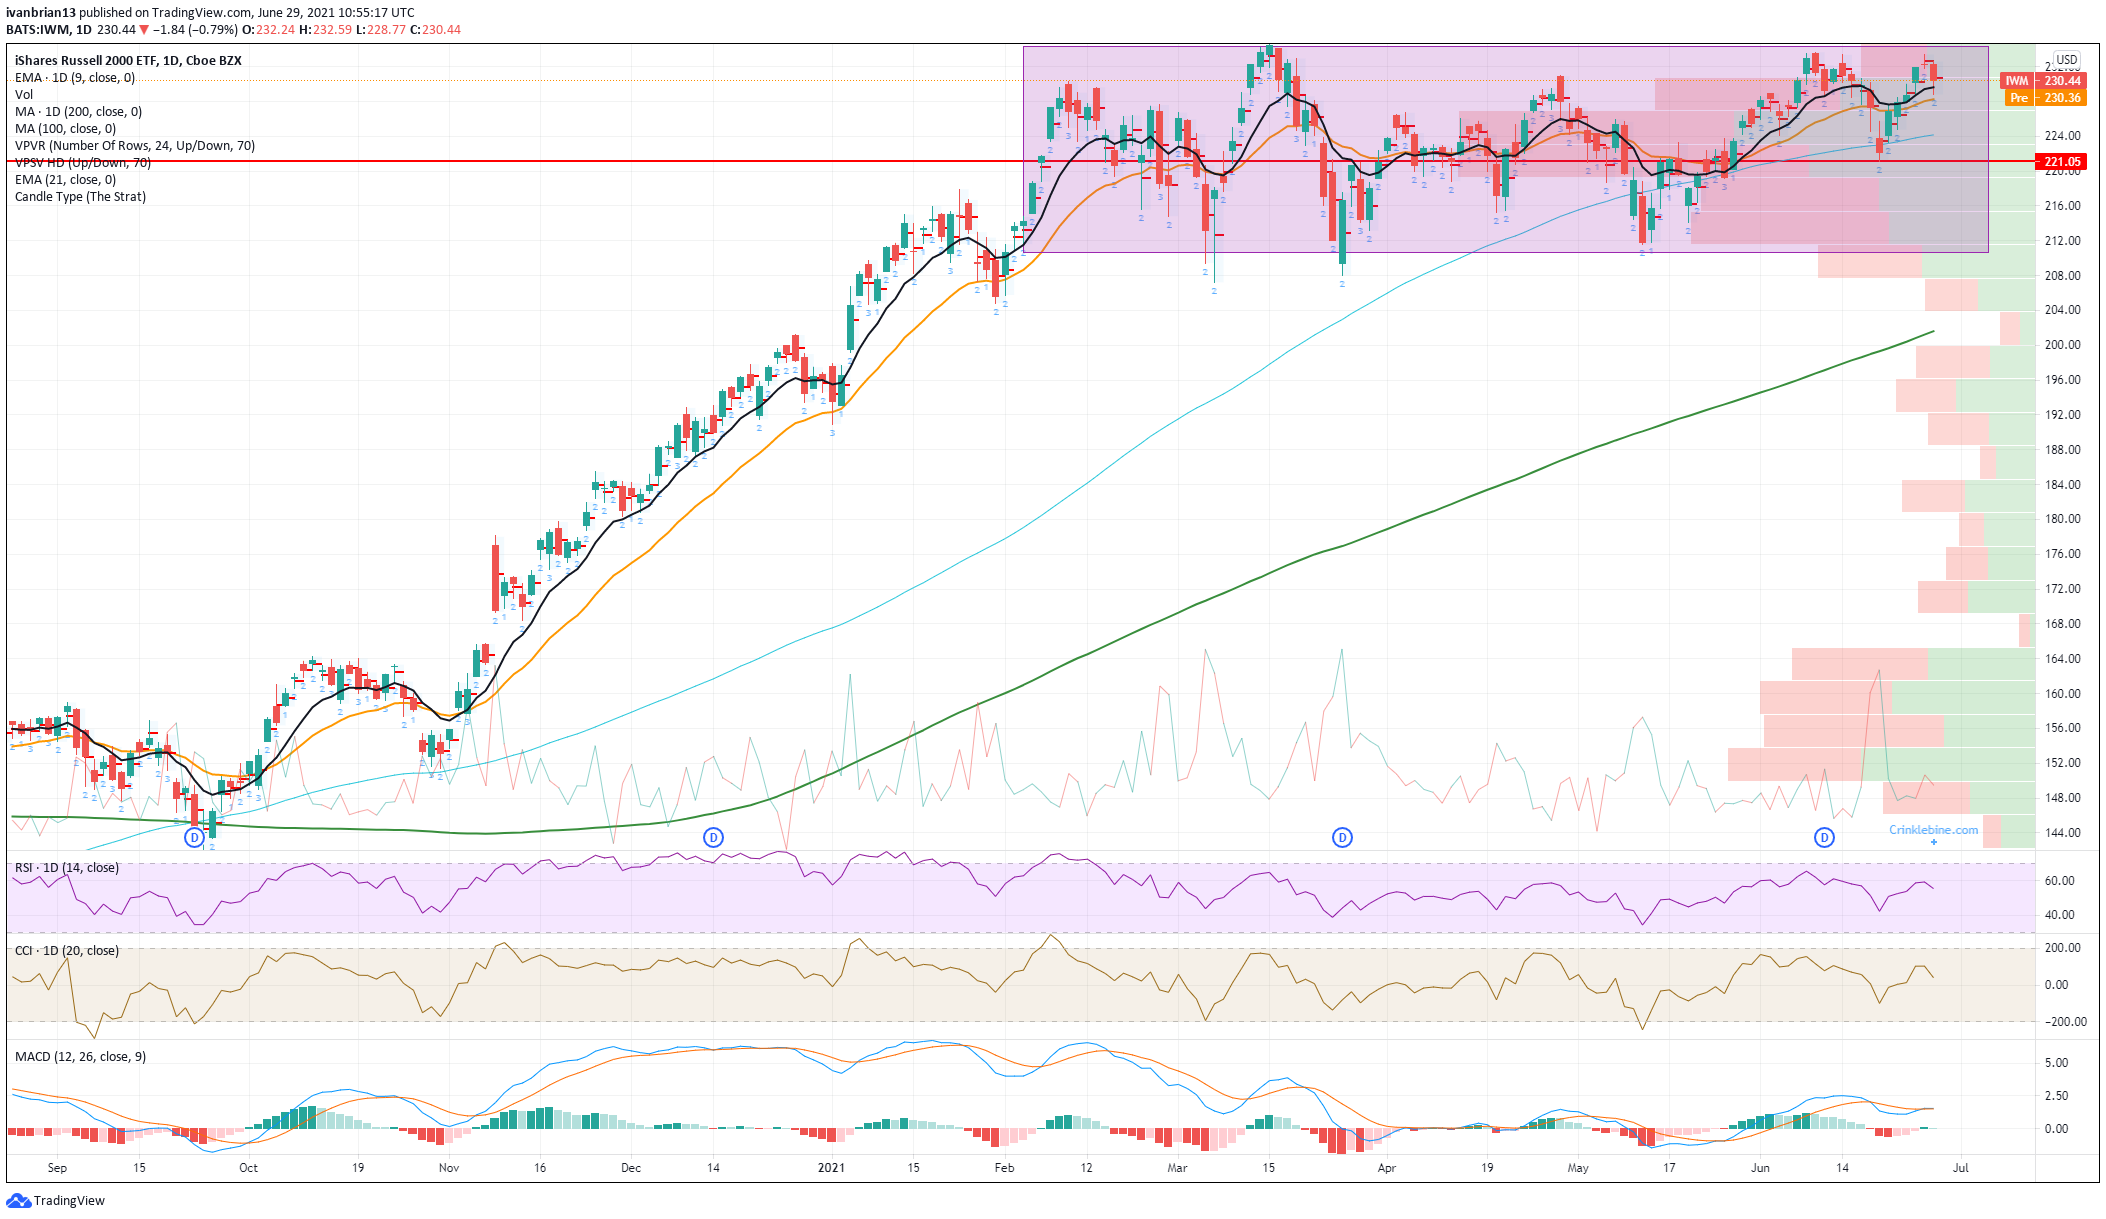
Update: With just over an hour left in the regular session equities are slumbering their way to the finish line. Little in the way of strong newsflow and stretched valuations ahead of earnings season is keeping things stable. worries over the delta variant hit equities hard in Asia overnight but so far the US is proving immune to the fear. Despite this, the VIX does pop modestly to 16.3 and the put/call ratio continues to move more heavily to puts. The UK is on the cusp of a delta variant wave so this will need close attention in the coming days for read across to US equities. Our three risks remain the delta variant, the Russell 2000 (IWM) forming a bearish triple top (see below) and the Nasdaq Relative Strength Index (RSI) remaining in overbought territory.
Various commentators keep calling the top of the equity market, and various commentators are proven consistently wrong. In fairness, calling the top of a runaway train is no easy task, and that is basically what equity markets have been since March 2020. The Fed balance sheet has again printed new highs, and this has been corresponding nicely with a resultant high in equity markets. The Fed shows no sign of tapering just yet, despite the word finally being mentioned in Fed parlance.
The Nasdaq struggled in the early part of the year as the bond market issued a face-off to the Fed. Yields spiked and interest rate sensitive stocks, of which the Nasdaq has many, suffered. The 10-year yield looked to be heading for 2% at one stage, but the Fed stared down the bond market and has won the battle for now. The war will come as recent inflation data has shown. Wholesale prices and the latest PCE data make for sobering reading with most inflation indicators hitting multi-decade highs. The Fed-hoped-for, transitory inflation pattern will be severely tested. The bond market is in summer lull mode, so equities have free rein to push higher.
The chart below shows the strength of the Nasdaq's relative performance since May, a complete turnaround to the first quarter of the year. The Dow Jones has now become the laggard, and most worrying from an overall perspective is the weakness of the Russell 2000 (IWM). As we have mentioned this is in a large range and needs to break out or else risk creating a bearish triple top, see lower chart.
-637605608006706411.png)
S&P 500 forecast
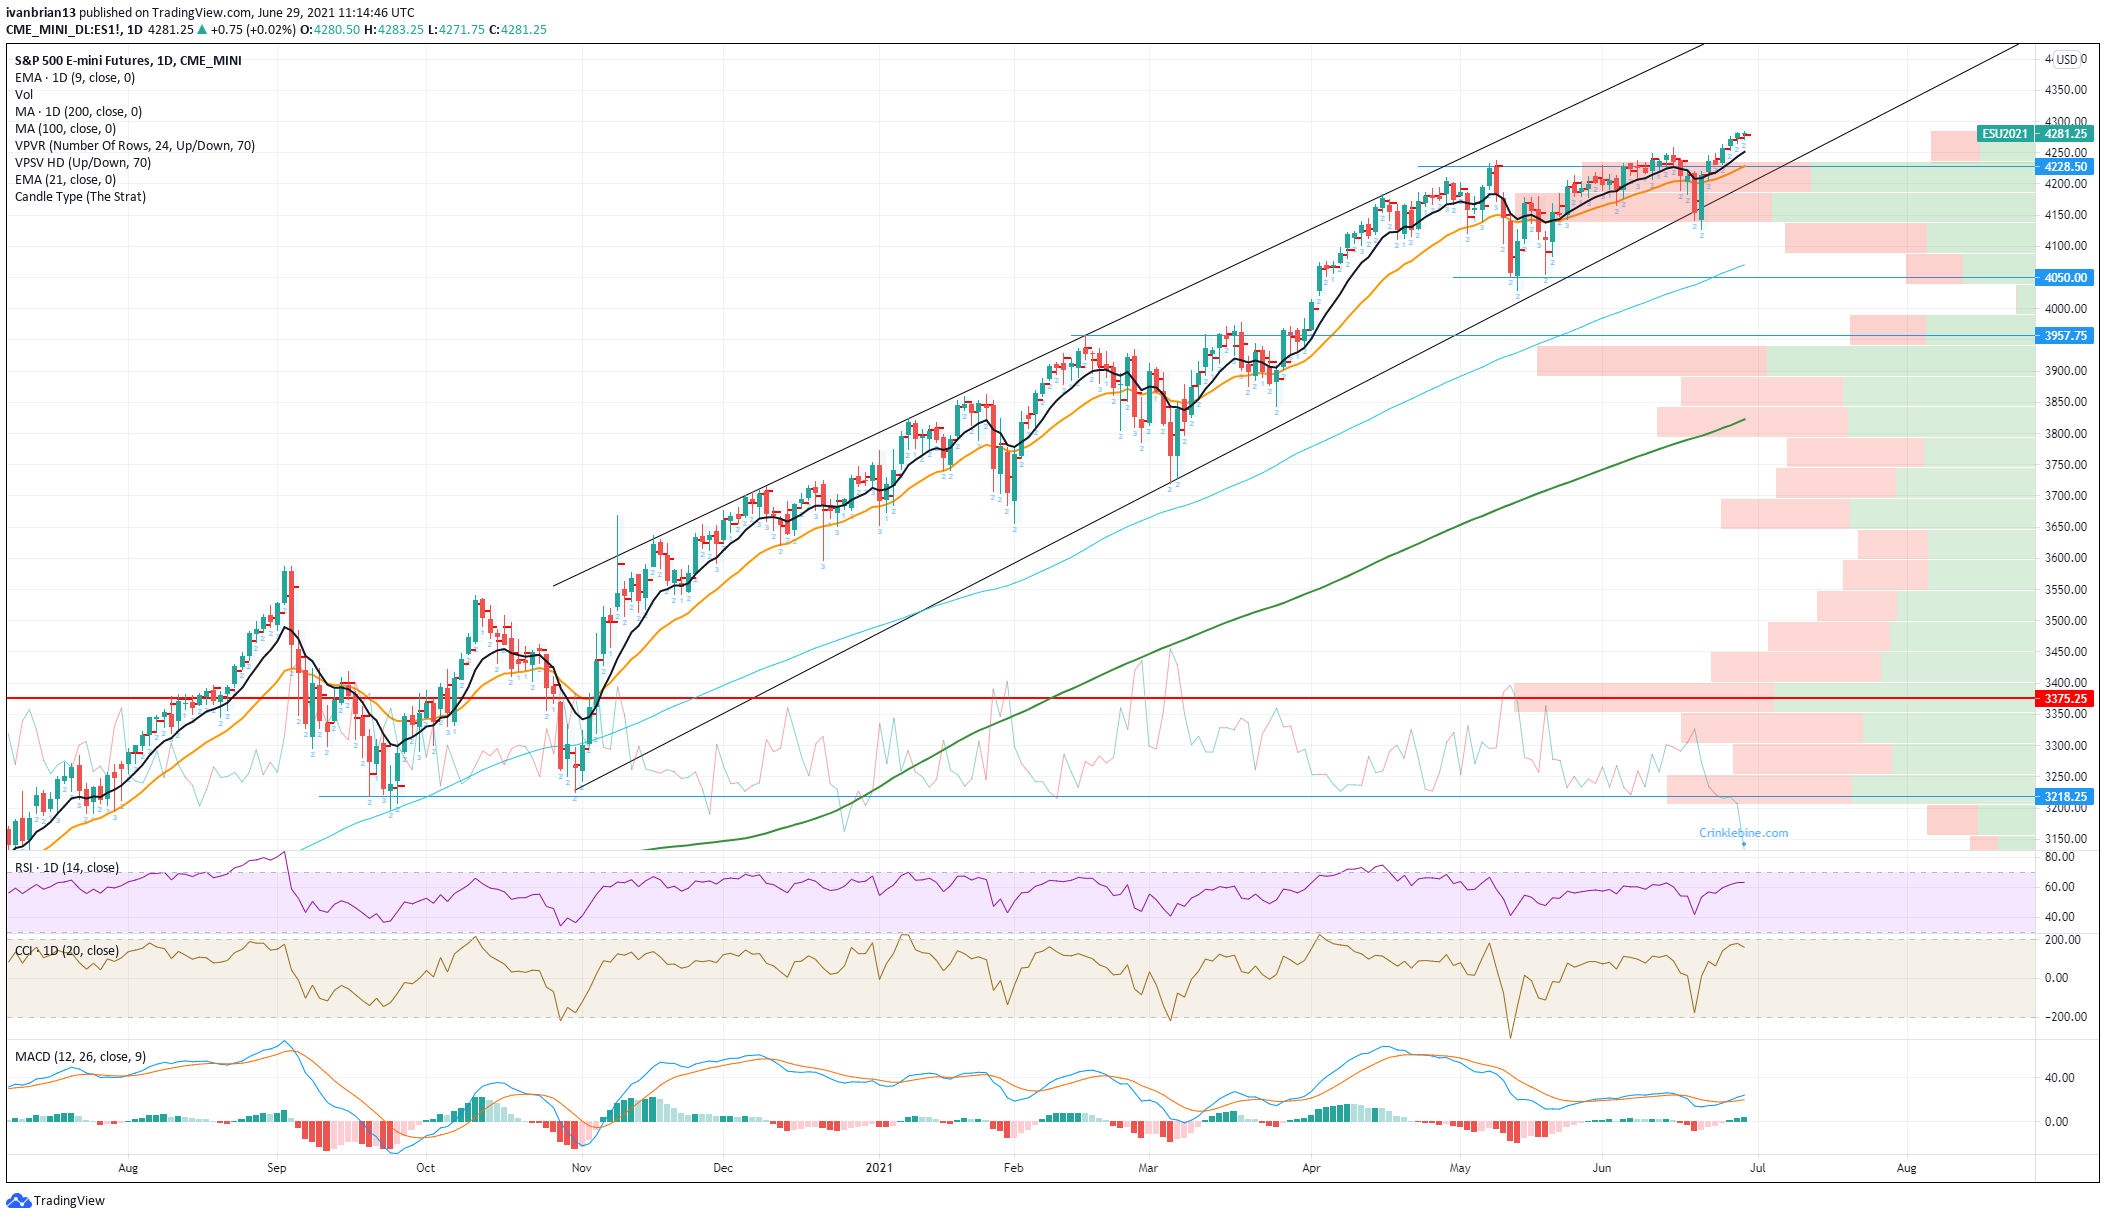
We use the E-mini futures contract (ES) for our analysis as it is the most traded S&P proxy, closely followed by the S&P 500 Exchange Traded Fund (ETF), the SPY. The strong uptrend remains firmly in place, and the channel is really the only meaningful resistance. Based on the average length of time the S&P has taken to move from the bottom to the top of this channel, we are looking at above 4,550 as resistance sometime in early August. So just another 10% then. Seems a bit optimistic to be writing that, but such is the equity market we currently reside in. The trend is your friend, as the old adage goes, and this one is strong. Over in Nasdaq world, the Relative Strength Index (RSI) has drifted into overbought territory, so keep an eye on this. Note though that an overbought reading can be returned to neutral with some sideways consolidation price action. It does not mean a sell-off to correct. But the move may be slowing or stalling. 4,228 is the short-term support and close to the 21-day moving average. This means a buy-the-dip strategy with a tight stop may work. Personally, I would rather wait for a pullback to somewhere along the trend line at 4,200. A break of that brings the move outside the channel and toward strong support in a more medium to long time frame at 4,050. This really needs to hold as a break will likely accelerate due to volume dropping off, see the volume profile on the right side of the chart.
As the move is stalling, options volatility is dropping, making buying options cheaper and that may be the smart play. VIX at 15 demonstrates the low volatility play. This makes bullish and bearish option plays cheaper. Depending on your view, the appropriate option strategy can work and offers built-in risk protection. Always know your risk and manage it.
The risk-reward is skewed to the upside. Risks as we see it are from the delta variant causing more lockdowns, the Russell 2000 (IWM) forming a triple top, and the Nasdaq RSI being overbought.
Like this article? Help us with some feedback by answering this survey:
Author

Ivan Brian
FXStreet
Ivan Brian started his career with AIB Bank in corporate finance and then worked for seven years at Baxter. He started as a macro analyst before becoming Head of Research and then CFO.


