Pound Sterling falls on robust US Q2 GDP growth, firm BoE rate-cut bets
- The Pound Sterling declines against the US Dollar to nearly 1.2880 on upbeat US Q2 flash GDP data.
- Firm preliminary S&P Global/CIPS PMI for July has improved the UK’s economic outlook.
- BoE officials hesitate to authenticate market speculation for a rate cut in August.

The Pound Sterling (GBP) exhibits a poor performance against its major peers, except the Australian Dollar (AUD) and the New Zealand Dollar (NZD), on Thursday. The British currency has faced significant pressure as market experts see the Bank of England (BoE) pivoting to policy normalization in August.
A Reuters poll conducted July 18-24 showed that more than 80% of economists said the BoE will reduce its key borrowing rates by 25 basis points (bps) to 5% in the August meeting. However, the prediction of a rate-cut in June’s poll was higher, with 97% of respondents favoring a rate-cut move. Contrary to Reuters’ poll, market participants are only pricing in a 45% chance for rate cuts in August.
An absence of BoE officials’ endorsement for rate cuts seems to have kept market speculation limited. The United Kingdom’s annual headline inflation has returned to the central bank’s desired rate of 2%. However, policymakers hesitate to authenticate rate-cut expectations amid fears of wage growth remaining persistent, which fuels inflationary pressures in the service sector.
On the economic data front, the upbeat preliminary UK S&P Global/CIPS report for July has indicated a firm start to the third quarter. The Composite PMI came in higher at 52.7 than estimates of 52.6 and the former release of 52.3 due to an increase in activities in the manufacturing as well as service sectors. The Manufacturing and Services PMI expanded to 51.8 and 52.4, respectively, outperforming their former releases.
Daily digest market movers: Pound Sterling remains on backfoot as BoE rate-cut bets surge
- The Pound Sterling weakens to 1.2880 against the US Dollar (USD) in Thursday’s American session. The GBP/USD pair declines on strong preliminary United States (US) Q2 Gross Domestic Product (GDP) data. The US Q2 GDP report showed that the economy expanded at a robust pace of 2.8% from the consensus of 2.0% and the former release of 1.4%. This has significantly improved the US economic outlook.
- The US Dollar Index (DXY), which tracks the Greenback’s value against six major currencies, recovers to a weekly high near 104.50.
- However, a sharp decline in the GDP Price Index has brought relief for Federal Reserve (Fed) policymakers and has cemented expectations of interest rate cuts in September. The GDP Price Index decelerated at a faster pace to 2.3% from the estimates of 2.6% and the former release of 3.1%.
- Going forward, the major trigger for the US Dollar will be the Personal Consumption Expenditures Price Index (PCE) data for June, which will be published on Friday. The core PCE inflation, the Fed’s preferred inflation gauge, is estimated to have decelerated to 2.5% from May’s figure of 2.6%, with the monthly figure growing steadily by 0.1%.
Pound Sterling Price Today:
British Pound PRICE Today
The table below shows the percentage change of British Pound (GBP) against listed major currencies today. British Pound was the strongest against the Australian Dollar.
| GBP | EUR | USD | JPY | CAD | AUD | NZD | CHF | |
|---|---|---|---|---|---|---|---|---|
| GBP | -0.22% | -0.16% | -0.92% | -0.02% | 0.55% | 0.13% | -0.63% | |
| EUR | 0.22% | 0.05% | -0.71% | 0.20% | 0.75% | 0.34% | -0.42% | |
| USD | 0.16% | -0.05% | -0.76% | 0.15% | 0.70% | 0.30% | -0.47% | |
| JPY | 0.92% | 0.71% | 0.76% | 0.91% | 1.45% | 1.03% | 0.28% | |
| CAD | 0.02% | -0.20% | -0.15% | -0.91% | 0.56% | 0.15% | -0.62% | |
| AUD | -0.55% | -0.75% | -0.70% | -1.45% | -0.56% | -0.39% | -1.17% | |
| NZD | -0.13% | -0.34% | -0.30% | -1.03% | -0.15% | 0.39% | -0.78% | |
| CHF | 0.63% | 0.42% | 0.47% | -0.28% | 0.62% | 1.17% | 0.78% |
The heat map shows percentage changes of major currencies against each other. The base currency is picked from the left column, while the quote currency is picked from the top row. For example, if you pick the British Pound from the left column and move along the horizontal line to the US Dollar, the percentage change displayed in the box will represent GBP (base)/USD (quote).
Technical Analysis: Pound Sterling continues to face selling pressure near 1.2900
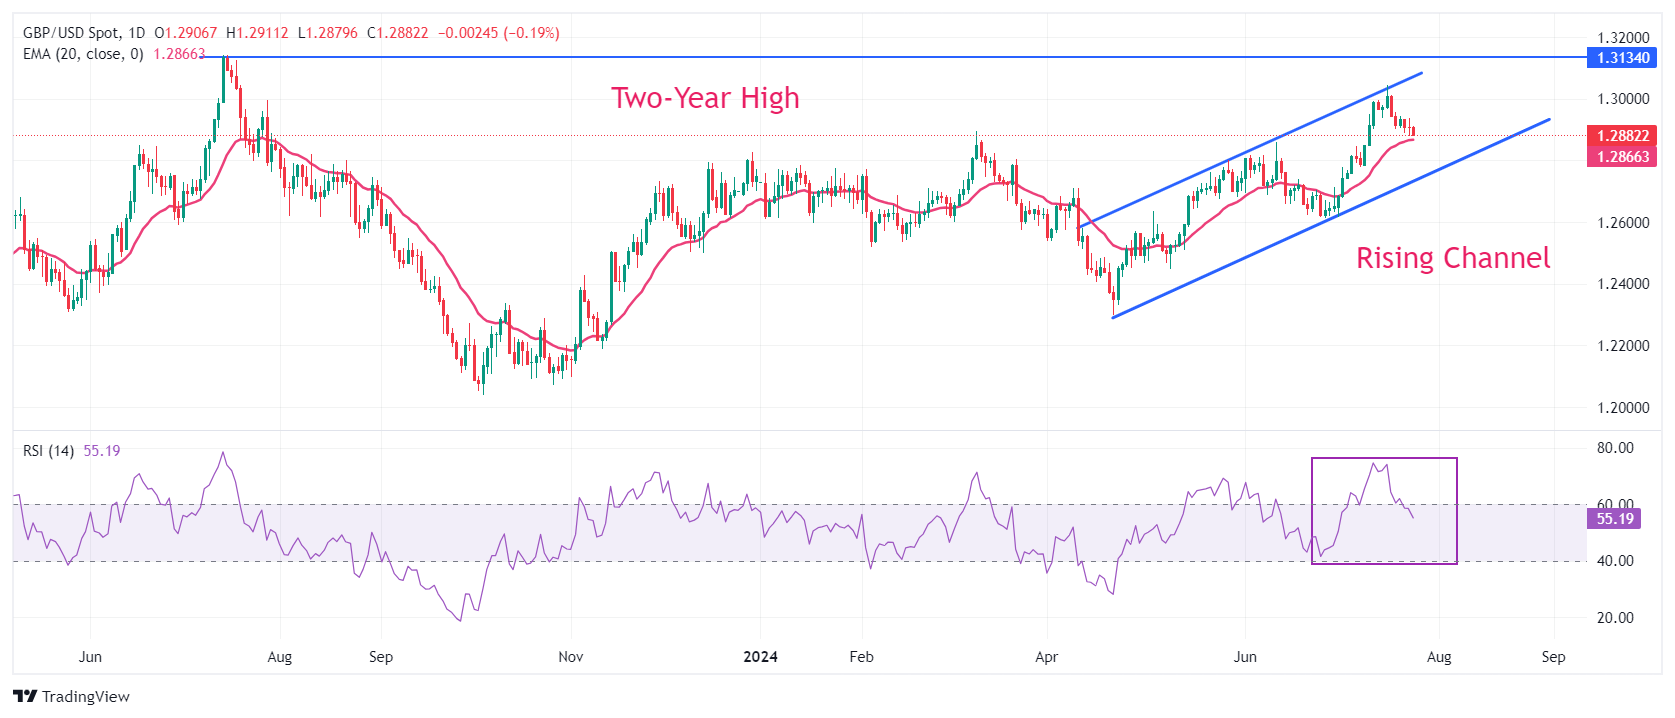
The Pound Sterling skids below the crucial support of 1.2900 against the US Dollar. The GBP/USD pair trades in a Rising Channel formation on a daily timeframe, in which each pullback move is considered a buying opportunity by market participants. The Cable holds the key 20-day Exponential Moving Average (EMA), which trades around 1.2866.
The 14-day Relative Strength Index (RSI) returns within the 40.00-60.00 range, suggesting the bullish momentum has faded. However, the bullish bias remains intact.
On the upside, a two-year high near 1.3140 will be a key resistance zone for the Cable.
Economic Indicator
Gross Domestic Product Annualized
The real Gross Domestic Product (GDP) Annualized, released quarterly by the US Bureau of Economic Analysis, measures the value of the final goods and services produced in the United States in a given period of time. Changes in GDP are the most popular indicator of the nation’s overall economic health. The data is expressed at an annualized rate, which means that the rate has been adjusted to reflect the amount GDP would have changed over a year’s time, had it continued to grow at that specific rate. Generally speaking, a high reading is seen as bullish for the US Dollar (USD), while a low reading is seen as bearish.
Read more.Last release: Thu Jul 25, 2024 12:30 (Prel)
Frequency: Quarterly
Actual: 2.8%
Consensus: 2%
Previous: 1.4%
Source: US Bureau of Economic Analysis
The US Bureau of Economic Analysis (BEA) releases the Gross Domestic Product (GDP) growth on an annualized basis for each quarter. After publishing the first estimate, the BEA revises the data two more times, with the third release representing the final reading. Usually, the first estimate is the main market mover and a positive surprise is seen as a USD-positive development while a disappointing print is likely to weigh on the greenback. Market participants usually dismiss the second and third releases as they are generally not significant enough to meaningfully alter the growth picture.
Author

Sagar Dua
FXStreet
Sagar Dua is associated with the financial markets from his college days. Along with pursuing post-graduation in Commerce in 2014, he started his markets training with chart analysis.


