NZD/USD Price Forecast: Trades insides Monday’s range with focus on US inflation
- NZD/USD trades in a tight range as investors turn cautious ahead of US inflation data.
- The US inflation data will influence market speculation for Fed’s interest rate cut size this month.
- China’s weak deflation data weighs on antipodeans.

The NZD/USD pair edges higher to near 0.6150 but trades inside Monday’s trading range in Tuesday’s European session. The near-term outlook of the Kiwi asset remains uncertain as the United States (US) Consumer Price Index (CPI) data for August takes center stage, which will be published on Wednesday.
Economists estimate the annual headline inflation to have decelerated to 2.6% from 2.9% in July. This would be the lowest reading since March 2021, which will boost market speculation for the Federal Reserve (Fed) to start the policy-easing process this month with a large interest rate cut. In the same period, the core inflation -which excludes volatile food and energy prices- is estimated to have risen steadily by 3.2%.
Meanwhile, growing concerns over China’s economic outlook have weighed on the New Zealand Dollar (NZD), given that the Kiwi economy is one of the leading trading partners of the world’s second-largest nation. China’s producer inflation deflated at a faster-than-expected pace in August, which increased evidence of diminishing pricing power at the hands of factory owners due to sluggish household demand.
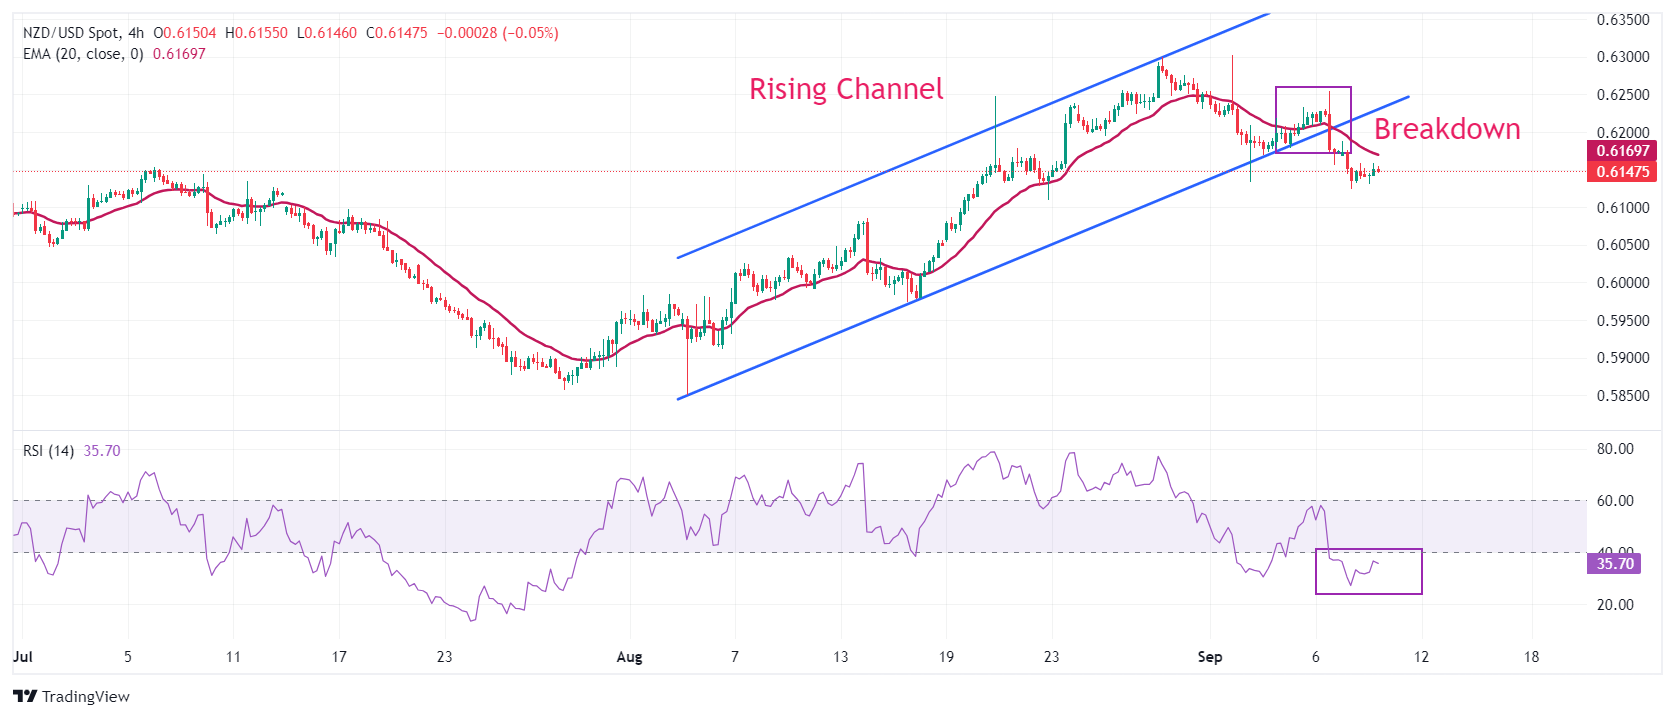
NZD/USD witnesses a steep fall after a breakdown of the Rising Wedge chart formation on a four-hour timeframe, which results in a bearish reversal. The 20-period Exponential Moving Average (EMA) at 0.6190 starts declining, suggesting the onset of a bearish trend in the short term.
The 14-period Relative Strength Index (RSI) shifts into the bearish range of 20.00-40.00, indicating that a bearish momentum has been triggered.
More downside would appear if the asset decisively breaks the July 17 high near 0.6100. This would push the asset lower to the May 3 high at 0.6046 and the psychological support of 0.6000.
In an alternate scenario, an upside move above the September 6 high of 0.6250 would drive the asset toward the September 2 high of 0.6300, followed by this year's high of 0.6330.
NZD/USD four-hour chart
New Zealand Dollar FAQs
The New Zealand Dollar (NZD), also known as the Kiwi, is a well-known traded currency among investors. Its value is broadly determined by the health of the New Zealand economy and the country’s central bank policy. Still, there are some unique particularities that also can make NZD move. The performance of the Chinese economy tends to move the Kiwi because China is New Zealand’s biggest trading partner. Bad news for the Chinese economy likely means less New Zealand exports to the country, hitting the economy and thus its currency. Another factor moving NZD is dairy prices as the dairy industry is New Zealand’s main export. High dairy prices boost export income, contributing positively to the economy and thus to the NZD.
The Reserve Bank of New Zealand (RBNZ) aims to achieve and maintain an inflation rate between 1% and 3% over the medium term, with a focus to keep it near the 2% mid-point. To this end, the bank sets an appropriate level of interest rates. When inflation is too high, the RBNZ will increase interest rates to cool the economy, but the move will also make bond yields higher, increasing investors’ appeal to invest in the country and thus boosting NZD. On the contrary, lower interest rates tend to weaken NZD. The so-called rate differential, or how rates in New Zealand are or are expected to be compared to the ones set by the US Federal Reserve, can also play a key role in moving the NZD/USD pair.
Macroeconomic data releases in New Zealand are key to assess the state of the economy and can impact the New Zealand Dollar’s (NZD) valuation. A strong economy, based on high economic growth, low unemployment and high confidence is good for NZD. High economic growth attracts foreign investment and may encourage the Reserve Bank of New Zealand to increase interest rates, if this economic strength comes together with elevated inflation. Conversely, if economic data is weak, NZD is likely to depreciate.
The New Zealand Dollar (NZD) tends to strengthen during risk-on periods, or when investors perceive that broader market risks are low and are optimistic about growth. This tends to lead to a more favorable outlook for commodities and so-called ‘commodity currencies’ such as the Kiwi. Conversely, NZD tends to weaken at times of market turbulence or economic uncertainty as investors tend to sell higher-risk assets and flee to the more-stable safe havens.
Author

Sagar Dua
FXStreet
Sagar Dua is associated with the financial markets from his college days. Along with pursuing post-graduation in Commerce in 2014, he started his markets training with chart analysis.


