|

NZD/USD Price Analysis: New Zealand Dollar weakens ahead of Q1GDP

  • NZD/USD falls to near 0.6130 as the New Zealand Dollar exhibits weakness ahead of the Q1 GDP data.
  • The USD Index holds its immediate support of 105.00 in a holiday market mood.
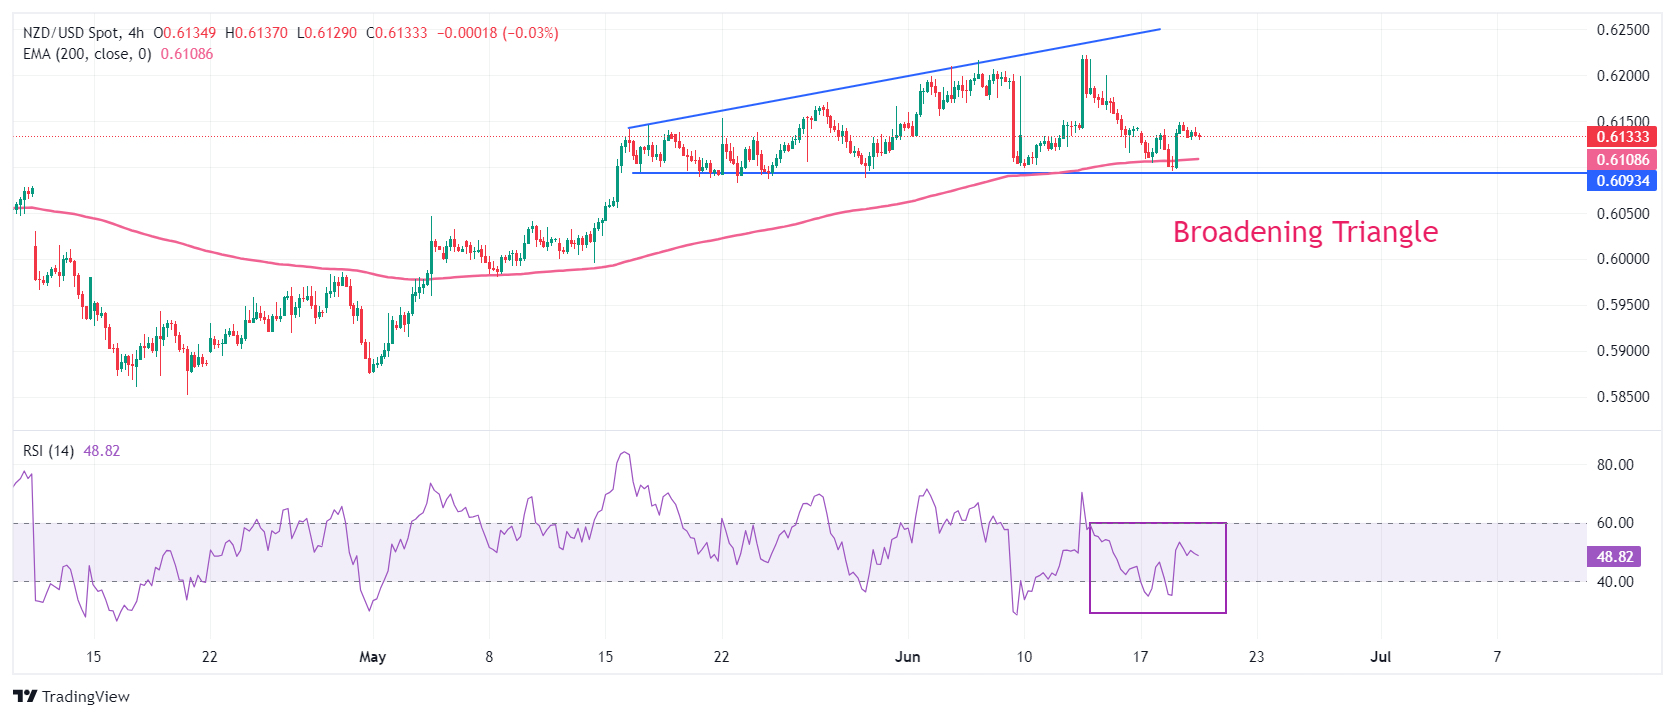
  • NZD/USD declines toward the horizontal support of the Broadening Triangle pattern.

The NZD/USD pair slumps to near 0.6130 in Wednesday’s American session. The Kiwi asset drops as the New Zaland Dollar comes under pressure ahead of the New Zealand (NZ) Q1 Gross Domestic Product (GDP) data, which will be published on Thursday. The NZ economy is estimated to have remained stagnant.

Weak economic performance would boost expectations of early rate cuts by the Reserve Bank of New Zealand (RBNZ). The RBNZ has been keeping its Official Cash Rate (OCR) higher at 5.5% for more than a year due to stubborn inflationary pressures.

Meanwhile, the US Dollar (USD) edges down in a thin volume trading session due to a holiday in United States (US) markets on account of Juneteenth. The US Dollar Index (DXY) holds its crucial support of 105.00. However, the near-term outlook has become uncertain as market participants expect the Federal Reserve (Fed) to cut interest rates twice this year.

This week, the US Dollar will be guided by preliminary S&P Global PMIs for June, which will be published on Thursday. The agency is expected to show a decline in the Composite PMI due to weakness in manufacturing as well as the service sector.

NZD/USD trades in a Broadening Triangle chart pattern on a four-hour timeframe in which the downside remains cushioned with the horizontal support, which is plotted from May 16 low around 0.6100. While the upside in the above-mentioned chart formation remains limited to the upward-sloping border, which in this case is marked from May 16 high around 0.6140.

The 200-period Exponential Moving Average (EMA) near 0.6101 continues to provide support to the New Zealand Dollar bulls.

The 14-period Relative Strength index (RSI) hovers near 40.00. A break below the same will trigger a bearish momentum.

Fresh downside would appear if the asset delivers a decisive break below the round-level support of 0.6100. This would drag the asset towards April 4 high around 0.6050 and psychological support of 0.6000.

On the contrary, a reversal move above June 12 high of 0.6222, which will expose the asset January 15 high near 0.6250, followed by January 12 high near 0.6280.

NZD/USD four-hour chart

NZD/USD

Overview
Today last price0.6134
Today Daily Change-0.0009
Today Daily Change %-0.15
Today daily open0.6143
 
Trends
Daily SMA200.6146
Daily SMA500.605
Daily SMA1000.607
Daily SMA2000.6063
 
Levels
Previous Daily High0.6149
Previous Daily Low0.6096
Previous Weekly High0.6222
Previous Weekly Low0.6099
Previous Monthly High0.6171
Previous Monthly Low0.5875
Daily Fibonacci 38.2%0.6129
Daily Fibonacci 61.8%0.6116
Daily Pivot Point S10.611
Daily Pivot Point S20.6076
Daily Pivot Point S30.6057
Daily Pivot Point R10.6163
Daily Pivot Point R20.6182
Daily Pivot Point R30.6216

Author

Sagar Dua

Sagar Dua

FXStreet

Sagar Dua is associated with the financial markets from his college days. Along with pursuing post-graduation in Commerce in 2014, he started his markets training with chart analysis.

More from Sagar Dua
Share:

Markets move fast. We move first.

Orange Juice Newsletter brings you expert driven insights - not headlines. Every day on your inbox.

By subscribing you agree to our Terms and conditions.

Editor's Picks

EUR/USD: Sellers attack 1.1700 as USD stages a solid comeback

EUR/USD attacks 1.1700 amid heavy selling interest in the European trading hours on Wednesday. A solid comeback staged by the US Dollar weighs heavily on the pair, as traders look to USD short covering ahead of US CPI on Thursday. However, the downside could be capped by hawkish ECB expectations. 

GBP/USD slides toward 1.3300 after softer-than-expected UK inflation data

GBP/USD has come under intense selling pressure, eyeing 1.3300 in the European session on Wednesday. The UK annual headline and core CPI rose by 3.2% each, missing estimates of 3.5% and 3.4%, respectively, reaffirming dovish BoE expectations and smashing the Pound Sterling across the board. 

Gold: Bulls await breakout through multi-day-old range amid Fed rate cut bets

Gold attracts fresh buyers during the Asian session on Wednesday, though it remains confined in a multi-day-old trading range amid mixed fundamental cues. The global risk sentiment remains on the defensive amid economic woes and fears of the AI bubble burst. Moreover, dovish US Federal Reserve expectations lend support to the non-yielding yellow metal, though a modest US Dollar uptick might cap any further appreciating move.

Bitcoin, Ethereum and Ripple extend correction as bearish momentum builds

Bitcoin, Ethereum, and Ripple remain under pressure as the broader market continues its corrective phase into midweek. The weak price action of these top three cryptocurrencies by market capitalization suggests a deeper correction, as momentum indicators are beginning to tilt bearish.

Ukraine-Russia in the spotlight once again

Since the start of the week, gold’s price has moved lower, but has yet to erase the gains made last week. In today’s report we intend to focus on the newest round of peace talks between Russia and Ukraine, whilst noting the release of the US Employment data later on day and end our report with an update in regards to the tensions brewing in Venezuela.

AAVE slips below $186 as bearish signals outweigh the SEC investigation closure

Aave (AAVE) price continues its decline, trading below $186 at the time of writing on Wednesday after a rejection at the key resistance zone. Derivatives positioning and momentum indicators suggest that bearish forces still dominate in the near term.