NZD/USD Price Analysis: More downside looks likely towards 0.5770
- NZD/USD recovers mildly after refreshing the yearly low near 0.5820, however, the outlook remains bearish.
- The Fed is expected to take an “extended pause” after cutting interest rates next month.
- Investors expect the RBNZ to cut interest rates by 50 bps to 4.25% on Wednesday.

The NZD/USD pair rebounds slightly after posting a fresh yearly low near 0.5820 in the North American session on Friday. The Kiwi pair remains on the backfoot as the US Dollar (USD) performs strongly across the board on expectations that the Federal Reserve (Fed) will follow the interest rate cut path more gradually.
Analysts at Deutsche Bank expect that the Fed could take an “extended pause” that keeps Federal Fund rates above 4% through 2025. Their comments were backed by expectations that “The Republican sweep promises transformative changes,” policies such as higher import tariffs will likely boost growth to 2.5% next year and will also lead to inflation stalling at or above 2.5% through 2026.
For the December meeting, analysts expect the Fed to cut interest rates by 25 basis points (bps). According to the CME FedWatch tool, there is a 59% chance that the Fed will cut its key borrowing rates by 25 bps to 4.25%-4.50%.
On the New Zealand Dollar (NZD) front, investors will focus on the Reserve Bank of New Zealand (RBNZ) monetary policy, which will be announced on Wednesday. The RBNZ is expected to cut interest rates by 50 bps to 4.25%. This will be the third consecutive interest rate cut by the RBNZ and the second straight 50 bps reduction in a row.
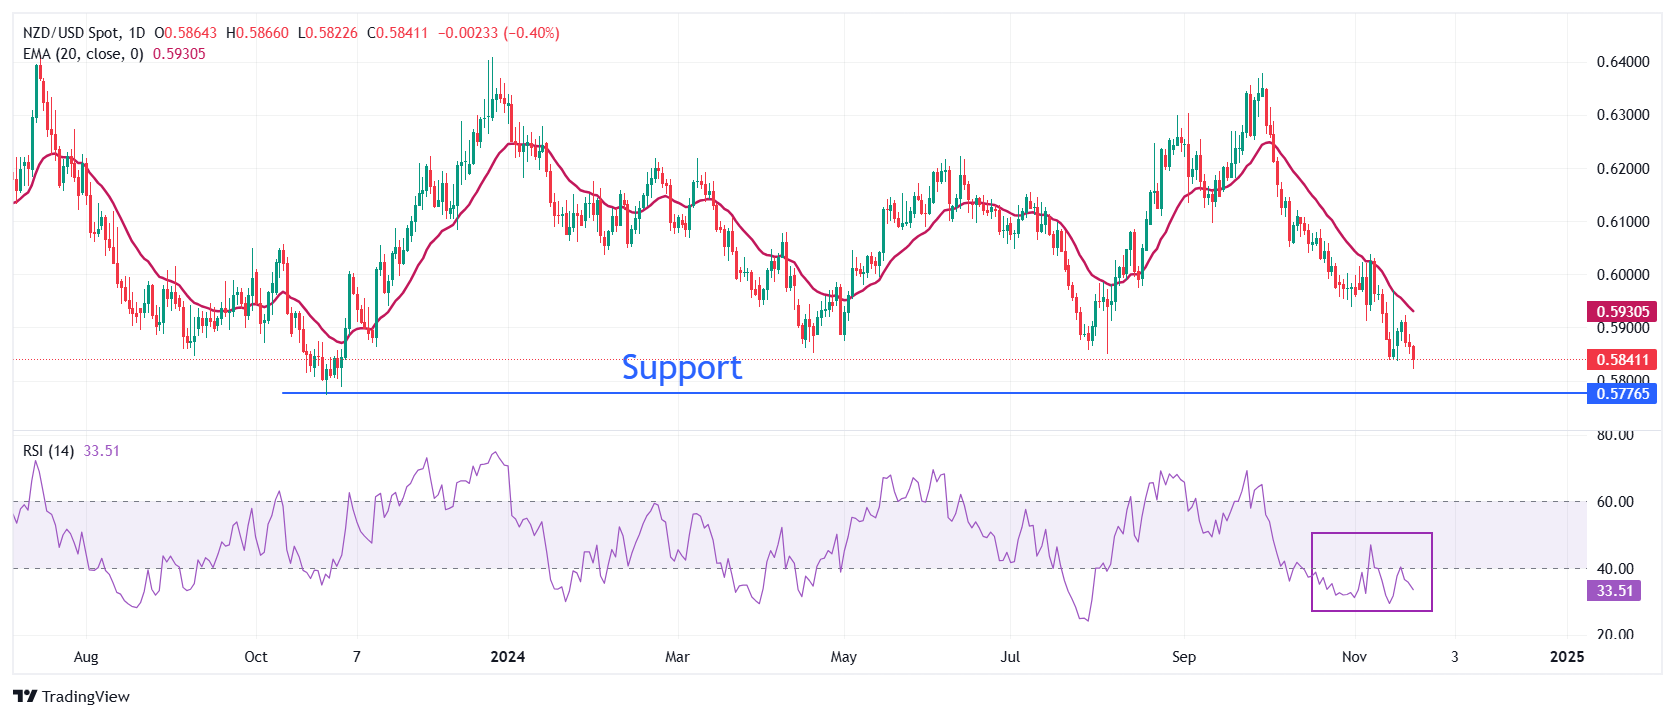
NZD/USD extends its losing streak for the third trading day on Friday. The 20-day Exponential Moving Average (EMA) near 0.5930 continues to act as a major barricade for the NZD bulls. The 14-day Relative Strength Index (RSI) oscillates in the 20.00-40.00, suggesting that downside momentum is intact.
The Kiwi pair is expected to decline to near the October 2023 low at 0.5770 and the round-level support of 0.5700 after breaking below the intraday low of 0.5820.
On the contrary, an upside move above the November 15 high of 0.5970 will drive the asset toward the psychological figure of 0.6000 and the November 7 high of 0.6040.
NZD/USD daily chart
New Zealand Dollar FAQs
The New Zealand Dollar (NZD), also known as the Kiwi, is a well-known traded currency among investors. Its value is broadly determined by the health of the New Zealand economy and the country’s central bank policy. Still, there are some unique particularities that also can make NZD move. The performance of the Chinese economy tends to move the Kiwi because China is New Zealand’s biggest trading partner. Bad news for the Chinese economy likely means less New Zealand exports to the country, hitting the economy and thus its currency. Another factor moving NZD is dairy prices as the dairy industry is New Zealand’s main export. High dairy prices boost export income, contributing positively to the economy and thus to the NZD.
The Reserve Bank of New Zealand (RBNZ) aims to achieve and maintain an inflation rate between 1% and 3% over the medium term, with a focus to keep it near the 2% mid-point. To this end, the bank sets an appropriate level of interest rates. When inflation is too high, the RBNZ will increase interest rates to cool the economy, but the move will also make bond yields higher, increasing investors’ appeal to invest in the country and thus boosting NZD. On the contrary, lower interest rates tend to weaken NZD. The so-called rate differential, or how rates in New Zealand are or are expected to be compared to the ones set by the US Federal Reserve, can also play a key role in moving the NZD/USD pair.
Macroeconomic data releases in New Zealand are key to assess the state of the economy and can impact the New Zealand Dollar’s (NZD) valuation. A strong economy, based on high economic growth, low unemployment and high confidence is good for NZD. High economic growth attracts foreign investment and may encourage the Reserve Bank of New Zealand to increase interest rates, if this economic strength comes together with elevated inflation. Conversely, if economic data is weak, NZD is likely to depreciate.
The New Zealand Dollar (NZD) tends to strengthen during risk-on periods, or when investors perceive that broader market risks are low and are optimistic about growth. This tends to lead to a more favorable outlook for commodities and so-called ‘commodity currencies’ such as the Kiwi. Conversely, NZD tends to weaken at times of market turbulence or economic uncertainty as investors tend to sell higher-risk assets and flee to the more-stable safe havens.
Author

Sagar Dua
FXStreet
Sagar Dua is associated with the financial markets from his college days. Along with pursuing post-graduation in Commerce in 2014, he started his markets training with chart analysis.


![How Wall Street rigs the game [Video]](https://editorial.fxsstatic.com/images/i/market-chaos-01.jpg)














