NZD/USD Price Analysis: Exhibits volatility contraction near 0.6070
- NZD/USD declines to 0.6070 as the US Dollar gains firm footing.
- Investors expect that the Fed will start reducing interest rates in September.
- Higher-than-expected decline in NZ inflation has boosted early RBNZ rate-cut hopes.

The NZD/USD pair edges lower to near 0.6070 in Thursday’s American session. The kiwi asset drops as the US Dollar Index (DXY) gains ground after falling to almost a fresh four-month low near 103.70.
While the near-term outlook of the US Dollar (USD) remains uncertain as the Federal Reserve (Fed) is widely anticipated to begin cutting interest rates from the September meeting.
After a slower-than-expected United States (US) Consumer Price Index (CPI) report for June, Fed policymakers have gained some confidence that interest rates become warranted in the near term. On Wednesday, On Wednesday, Richmond Fed Bank President Thomas Barkin cited broadening disinflation as “very encouraged”. Barkin added he is sure policymakers will debate at the July policy meeting whether it is still appropriate to describe inflation as elevated, Reuters reported.
Meanwhile, growing speculation for early rate cuts by the Reserve Bank of New Zealand (RBNZ) has weighed on the New Zealand Dollar (NZD). The expectations for RBNZ early rate cuts rise as price pressures in the New Zealand (NZ) economy decelerated at a faster pace in the second quarter of this year.
NZ quarterly inflation grew by 0.4%, slower than expectations and Q1 reading of 0.6%. The annual CPI data decelerated at a robust pace to 3.3% from the consensus of 3.5% and the former release of 4.0%.
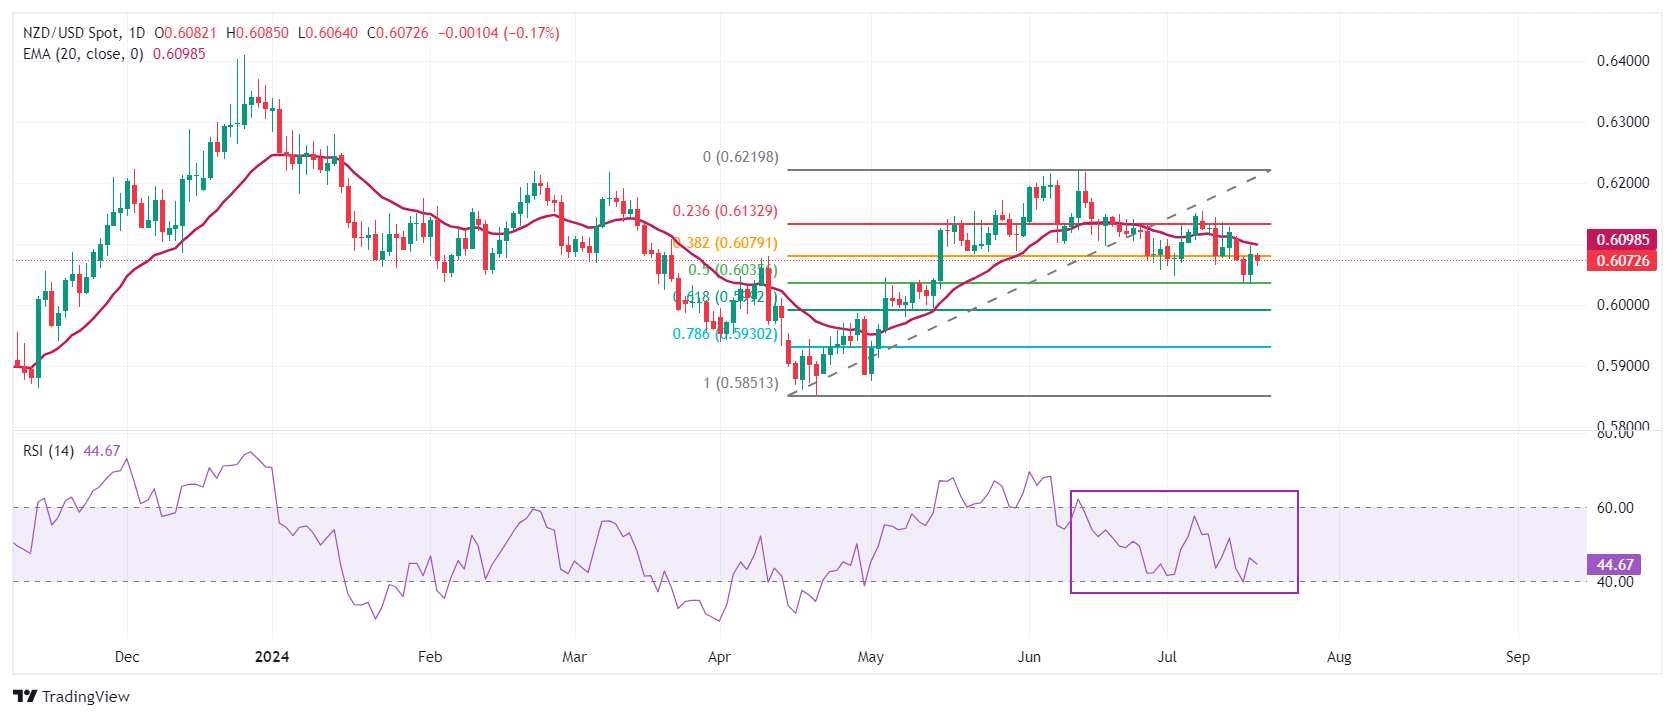
NZD/USD oscillates inside Wednesday’s trading range. Earlier, the asset finds a temporary support near 50% Fibonacci retracement (plotted from April 19 low near 0.5850 to June 12 high at 0.6222) at 0.6035 on a daily timeframe. The near-term outlook remains bearish as the 20-day Exponential Moving Average (EMA) near 0.6100 acts as major barricade to NZD bulls.
The 14-period Relative Strength Index (RSI) oscillates in the 40.00-60.00 range, suggesting indecisiveness among market participants.
Fresh upside would appear if the asset breaks above July 3 high at 0.6130 for targets near May 28 high around 0.6170 and June 12 high of 0.6222.
However, a breakdown below April 4 high around 0.6050 would expose the asset to the psychological support of 0.6000.
NZD/USD daily chart
Economic Indicator
Consumer Price Index (QoQ)
The Consumer Price Index (CPI), released by Statistics New Zealand on a quarterly basis, measures changes in the price of goods and services bought by New Zealand households. The CPI is a key indicator to measure inflation and changes in purchasing trends. The QoQ reading compares prices in the reference quarter to the previous quarter. A high reading is seen as bullish for the New Zealand Dollar (NZD), while a low reading is seen as bearish.
Read more.Last release: Tue Jul 16, 2024 22:45
Frequency: Quarterly
Actual: 0.4%
Consensus: 0.6%
Previous: 0.6%
Source: Stats NZ
With the Reserve Bank of New Zealand's (RBNZ) inflation target being around the midpoint of 2%, Statistics New Zealand’s quarterly Consumer Price Index (CPI) publication is of high significance. The trend in consumer prices tends to influence RBNZ’s interest rates decision, which in turn, heavily impacts the NZD valuation. Acceleration in inflation could lead to faster tightening of the rates by the RBNZ and vice-versa. Actual figures beating forecasts render NZD bullish.
Author

Sagar Dua
FXStreet
Sagar Dua is associated with the financial markets from his college days. Along with pursuing post-graduation in Commerce in 2014, he started his markets training with chart analysis.


