|

NZD/USD Price Analysis: Exhibits sluggishness amid uncertainty over timing of Fed rate cuts

  • NZD/USD trades sideways as investors look for fresh Fed interest rate cues.
  • Investors see the Fed easing interest rates twice this year.
  • NZD/USD struggles for direction with focus on US core PCE inflation data.

The NZD/USD pair trades in a limited range between 0.6105-0.1030 in Monday’s early American session. The Kiwi asset consolidates as uncertainty over when the Federal Reserve (Fed) will start reducing interest rates has deepened. Investors see the Fed to begin reducing rates from the September and a subsequent move in the November or December meeting.

Contrary to market expectations, Fed policymakers see only one rate cut this year in the last quarter. Officials want to see inflation declining for months to gain conviction before pivoting to policy-normalization.

The US Dollar Index (DXY) has dropped to 105.50 amid a cheerful market mood. On Friday, the US Dollar witnessed strong buying interest as the preliminary S&P Global PMI report showed that overall activity surprisingly expanded, with robust improvement in the manufacturing and service sectors.

This week, investors will focus on the United States (US) core Personal Consumption Expenditure price index (PCE) for May, which will provide fresh cues on when and how much the central bank will reduce interest rates this year.

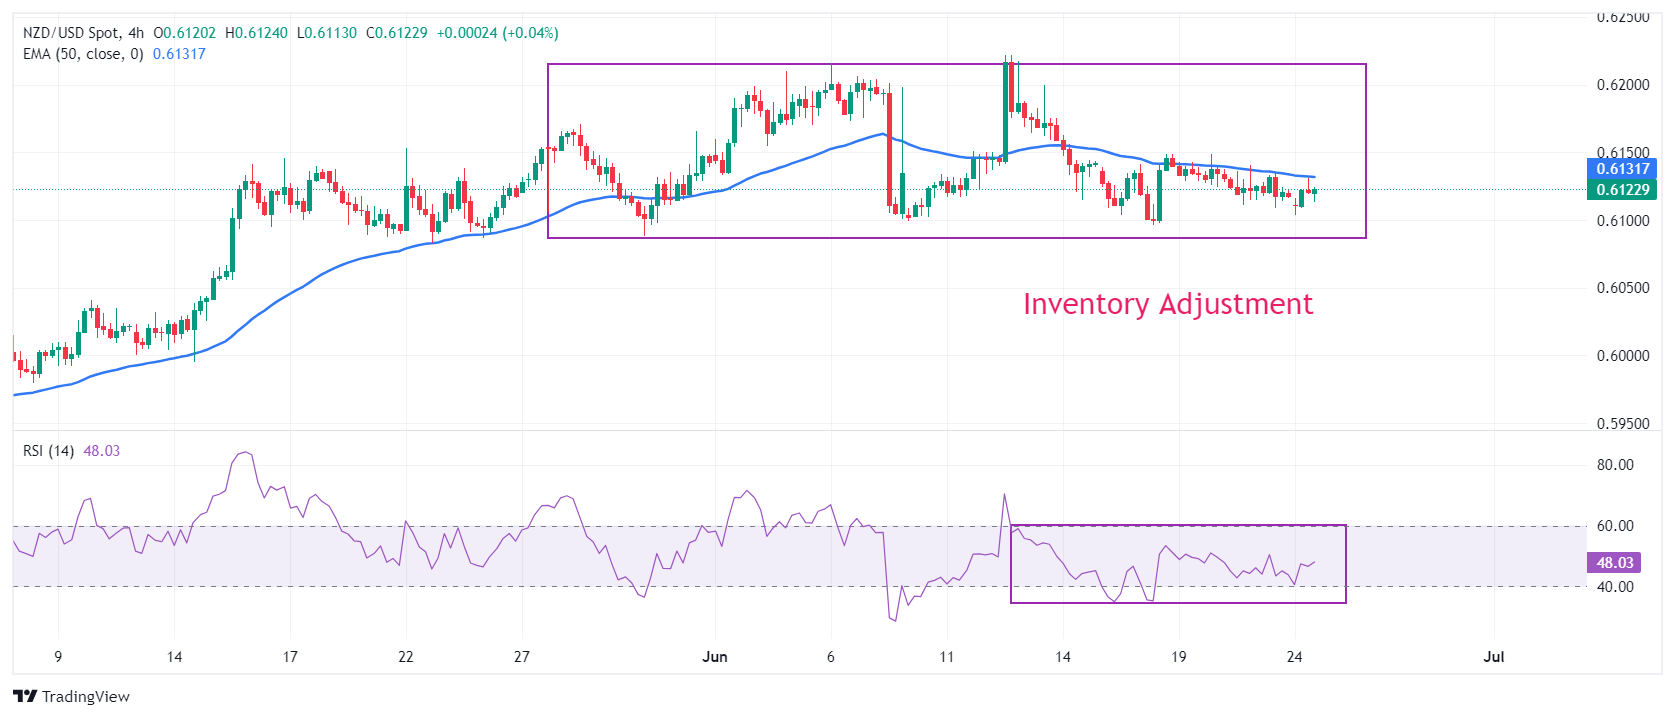
NZD/USD exhibits an inventory adjustment formation on a four-hour timeframe, which indicates an auction in a limited range with lower volume. Generally, the inventory adjustment process results in a decisive break in either direction. The Kiwi asset trades below the 50-period Exponential Moving Average (EMA) near 0.6133, suggesting a sharp volatility contraction.

The 14-period Relative Strength Index (RSI) oscillates in the 40.00-60.00 range, indicating indecisiveness among investors.

 Fresh downside would appear if the asset delivers a decisive break below the round-level support of 0.6100. This would drag the asset towards April 4 high around 0.6050 and psychological support of 0.6000.

On the contrary, a reversal move above June 12 high of 0.6222, which will expose the asset January 15 high near 0.6250, followed by January 12 high near 0.6280.

NZD/USD four-hour chart

NZD/USD

Overview
Today last price0.6125
Today Daily Change0.0007
Today Daily Change %0.11
Today daily open0.6118
 
Trends
Daily SMA200.6148
Daily SMA500.6058
Daily SMA1000.607
Daily SMA2000.6066
 
Levels
Previous Daily High0.614
Previous Daily Low0.6109
Previous Weekly High0.6149
Previous Weekly Low0.6096
Previous Monthly High0.6171
Previous Monthly Low0.5875
Daily Fibonacci 38.2%0.6121
Daily Fibonacci 61.8%0.6128
Daily Pivot Point S10.6104
Daily Pivot Point S20.6091
Daily Pivot Point S30.6073
Daily Pivot Point R10.6136
Daily Pivot Point R20.6154
Daily Pivot Point R30.6167

Author

Sagar Dua

Sagar Dua

FXStreet

Sagar Dua is associated with the financial markets from his college days. Along with pursuing post-graduation in Commerce in 2014, he started his markets training with chart analysis.

More from Sagar Dua
Share:

Editor's Picks

EUR/USD remains heavy near 1.1600 after hot EU inflation data

EUR/USD remains heavily offered near 1.1600, six-week lows, in the European session on Tuesday. The pair fails to find any inspiration from a surprise pick up in Eurozone inflation for February, as the US Dollar continues to attract safe haven flows amid escalating geopolitical tensions in the Middle East. 

GBP/USD attacks 1.3300, refreshing three-month lows

GBP/USD is deep in the red near 1.3300, accelerating its downside to renew three-month lows in European trading on Tuesday. The ongoing escalation in the Iran war, combined with rising Oil prices, weighs negatively on the higher-yielding Pound Sterling as the US Dollar capitalizes on increased haven demand.

Gold falls below $5,300 as stronger USD counter Middle East woes

Gold attracts some intraday selling and falls below $5,300 on Tuesday. The US Dollar climbs to a fresh high since January 20 and turns out to be a key factor exerting downward pressure on the commodity. However, concerns about a broader regional conflict in the Middle East continue to weigh on investors' sentiment and underpin demand for the traditional safe-haven bullion.

Stellar risks deeper losses as derivatives metrics turn negative

Stellar is trading red below $0.16 at the time of writing on Tuesday, after a slight recovery the previous day. Weakening derivatives data caps the recovery, while an unfavorable technical outlook projects a deeper correction for the XLM token in the upcoming days.

Middle East conflict ramps up a gear as energy price spike rips through markets

It’s another risk off day as geopolitical headwinds continue to batter financial markets. Although markets calmed during the US session and US stocks managed to post gains on Monday, this has not fed through to the European session, and stocks and bonds are sharply lower for a second day.

Hyperliquid Price Forecast: HYPE rises on commodities demand amid US-Iran war

Hyperliquid (HYPE) steadies above $33 at press time on Tuesday, marking its fourth consecutive day of recovery in a broadly volatile market due to the ongoing US-Israel strikes on Iran.