Gold little changed after US inflation data as expected
- Gold is consolidating under chart resistance as falling US yields and a tense geopolitical backdrop support the metal.
- Upside may be limited, however, by overextended positioning.
- The precious metal is at the top of a range-bound consolidation, with the short-term trend biased to extend sideways.

Gold (XAU/USD) trades in the $2,460s on Wednesday as it continues consolidating after its August rally. Falling US bond yields, which are negatively correlated to Gold, helped stimulate the rally. Safe-haven flows further support the Yellow Metal due to growing geopolitical concerns emanating from the Middle East and Russia-Ukraine conflict. These haven flows, however, may be capped due to overextended positioning, according to analysts.
The release of US Consumer Price Index (CPI) data has had a marginal impact on Gold. US CPI for July rose by 0.2% month-over-month, in line with estimates and higher than the 0.1% decline in June. Year-over-year it rose 2.9% as expected, and slightly below the previous month's 3.0% reading.
Core CPI came out at 0.2% MoM as forecast, and above the 0.1% of June. YoY core CPI rose 3.2% as predicted, and below the 3.3% of the previous month, according to data from the US Bureau of Labour Statistics.
Gold boosted by PPI undershoot
Gold gained a shot in the arm after the release of US Producer Price Index (PPI) data on Tuesday. The data showed an overall easing in inflationary conditions and increased expectations that interest rates are poised to fall in the US. Core PPI, in particular, failed to meet expectations.
Additionally, the Reserve Bank of New Zealand (RBNZ) made a surprise 0.25% cut to its policy rate early Wednesday, possibly suggesting interest rates are falling globally. Lower interest rates are positive for Gold because they make it more attractive to investors relative to other assets that pay interest.
Gold is “overbought” and offers limited upside potential
Gold may be limited in terms of its upside potential even if geopolitical risk intensifies, according to TD Securities. This view echoes that of IG Index and Redward Associates which highlighted extreme positioning in the Gold Futures market in a recent report.
“Gold as a safe-haven is not necessarily a compelling proposition,” says Daniel Ghali, Senior Commodity Strategist at TD Securities.
Whilst geopolitical risks from a potential imminent attack by Iran are supporting the Yellow Metal, the effect is limited because investors are already “over-committed”. This was reflected by Gold’s relatively tepid response to the panic selling triggered by the US Nonfarm Payrolls jobs data miss at the beginning of August.
“Not only are macro funds well positioned,” says the strategist, “Systematic trend followers are 'max long', and the bar for outflows continues to inch lower by the day. Asian speculators are also vulnerable, with near-record positions held in precious metals as a currency-depreciation hedge, the driver of which is now unwinding,” he adds.
Asian central banks had been hoarding Gold earlier in the year when the US Dollar (USD) rose following stickier-than-expected US inflation data in the Spring, which derailed Federal Reserve (Fed) rate-cut expectations. This led to an extreme devaluation of Asian FX against USD, and Asian central banks bought Gold as a currency hedge.
“This contrasts sharply with the early-year set-up, which featured a historic underpositioning that ultimately led to strong price performance. As safe-haven flows subside, several speculative cohorts' positions may be vulnerable to a reprice in lofty Fed expectations,” continues Ghali.
Only China’s retail demand remains resilient at the moment, according to the strategist, who says that flows into Chinese Gold ETFs remain strong, however, demand for ETFs outside of China has “resumed its decline”.
Technical Analysis: Gold continues consolidating beneath range ceiling
Gold is consolidating just under the ceiling of a range it has been bouncing up and down since July. The short-term trend is probably sideways and, given “the trend is your friend”, is more likely than not to extend in that direction.
XAU/USD 4-hour Chart
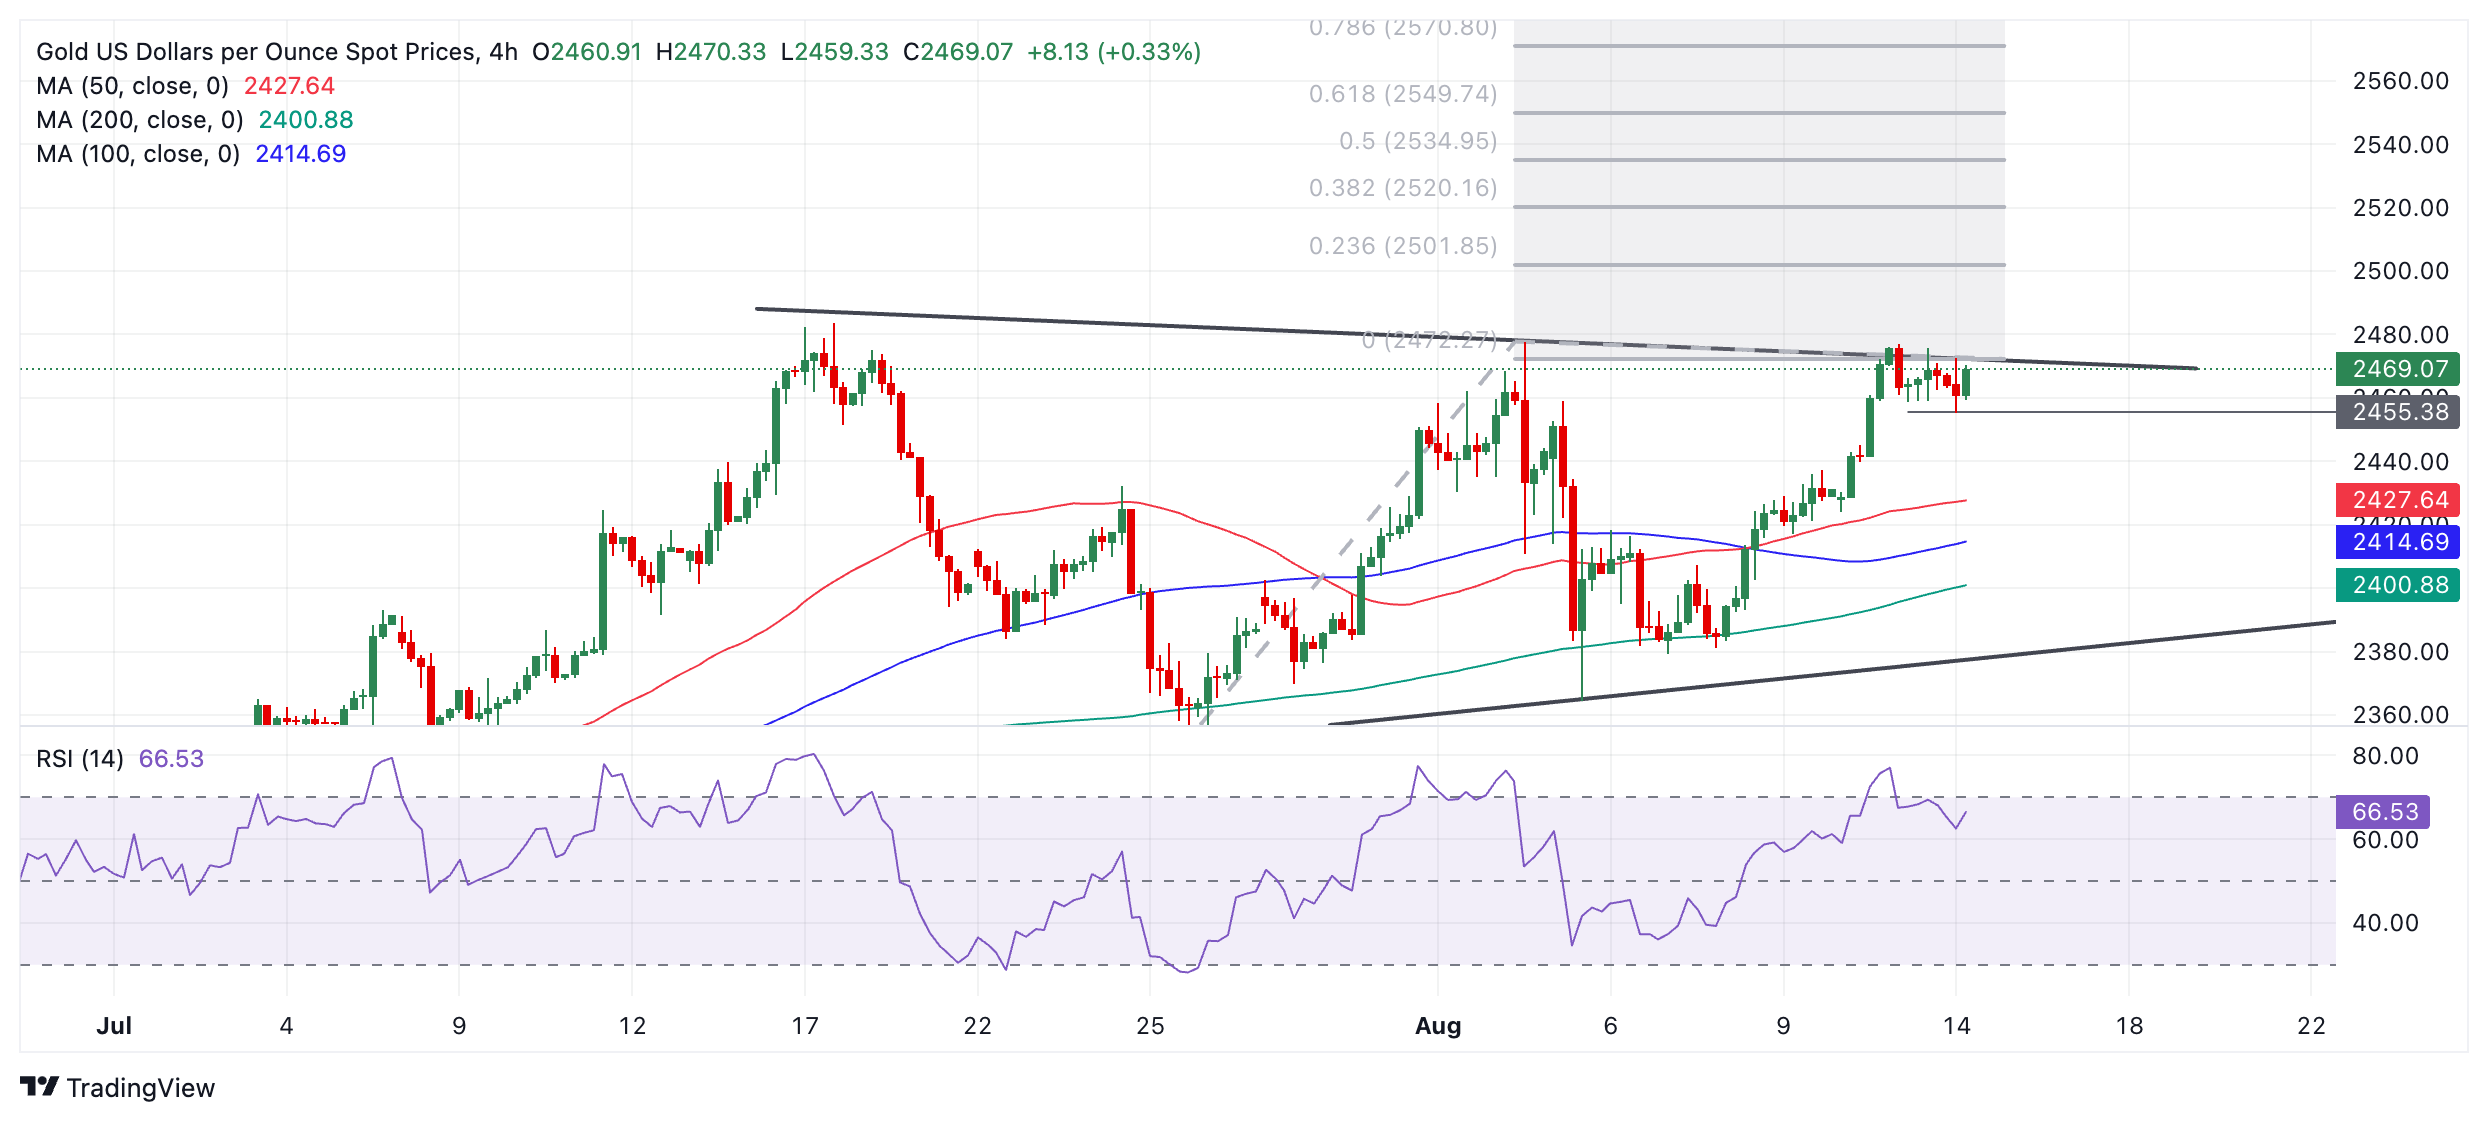
A break below $2,455 on a closing basis would help confirm the start of a fresh down leg within the range, thereby extending the sideways trend. If so, the price will probably move down to $2,400 or perhaps the range floor in the $2,390s. Due to the fact the range is tapering slightly, it might also be a triangle pattern in the final stages of development.
A decisive break above the range ceiling, however, would indicate the development of a more bullish trend. Such a breakout would probably follow through higher to at least $2,550, calculated by taking the 0.618 Fibonacci ratio of the range’s height and extrapolating it higher.
A decisive break would be one characterized by a long green candle that pierced clearly through the level and closed near its high, or three green candles in a row that breached the level.
Economic Indicator
Consumer Price Index (MoM)
Inflationary or deflationary tendencies are measured by periodically summing the prices of a basket of representative goods and services and presenting the data as The Consumer Price Index (CPI). CPI data is compiled on a monthly basis and released by the US Department of Labor Statistics. The MoM figure compares the prices of goods in the reference month to the previous month.The CPI is a key indicator to measure inflation and changes in purchasing trends. Generally, a high reading is seen as bullish for the US Dollar (USD), while a low reading is seen as bearish.
Read more.Last release: Wed Aug 14, 2024 12:30
Frequency: Monthly
Actual: 0.2%
Consensus: 0.2%
Previous: -0.1%
Source: US Bureau of Labor Statistics
The US Federal Reserve has a dual mandate of maintaining price stability and maximum employment. According to such mandate, inflation should be at around 2% YoY and has become the weakest pillar of the central bank’s directive ever since the world suffered a pandemic, which extends to these days. Price pressures keep rising amid supply-chain issues and bottlenecks, with the Consumer Price Index (CPI) hanging at multi-decade highs. The Fed has already taken measures to tame inflation and is expected to maintain an aggressive stance in the foreseeable future.
Author

Joaquin Monfort
FXStreet
Joaquin Monfort is a financial writer and analyst with over 10 years experience writing about financial markets and alt data. He holds a degree in Anthropology from London University and a Diploma in Technical analysis.


