Gold price slides further as US Biden drops re-election bid
- Gold price slides despite uncertainty over US presidential elections.
- US President Biden withdraws the re-election bid and nominates Kamala Harris to lead the Democrats.
- The US Dollar edges lower ahead of US data-packed week

Gold price (XAU/USD) dips below the key support of $2,400 in Monday’s New York session. The precious slips despite the nomination of Vice President Kamala Harris to lead Democrats against Donald Trump-led-Republicans deepenes United States (US) political uncertainty. The withdrawal of US President Joe Biden from the re-election bid paved the way for Kamala Harris as the nominee of Democrats. Historically, investors channel investments toward Gold as a hedge against political uncertainty.
Meanwhile, the US Dollar (USD) recovers its intraday losses amid increasing risk-aversion. The US Dollar Index (DXY), which tracks the Greenback’s value against six major currencies, holds its strong recovery to near 104.40 from a four-month low of 103.65. The recovery in the US Dollar was prompted by rising odds of Trump's win in presidential elections Market experts saw Trump’s victory as favorable for economic growth as he has promised cuts in corporate taxes and interest rates. This has fuelled upside risks to consumer inflation expectations. Experts also expect further trade restrictions if Republicans enter the White House. The prospects of Donald Trump winning elections grew after an assassination attack on him.
Daily digest market movers: Gold price slips while US Dollar recovers losses
- Gold price skids below the key support of $2,400 after declining consecutively for three trading days, with the focus on US data-packed week. The economic data will provide fresh cues about when the Federal Reserve (Fed) will start reducing interest rates this year.
- This week, investors will focus on the preliminary S&P Global Purchasing Managers Index (PMI) for July, Q2 Gross Domestic Product (GDP), and the Durable Goods Orders and Personal Consumption Expenditure Price Index (PCE) for June. According to the estimates, advanced PMI expanded at a slower pace than the previous month. Meanwhile, the GDP is expected to expand at a strong pace of 2.0% on an annualized basis from the former release of 1.4%.
- Investors will keenly focus on the core PCE inflation data, which is the Fed’s preferred inflation gauge. On a monthly basis, the inflation measure is estimated to have grown at a faster pace of 0.2% from the former reading of 0.1%.
- Currently, financial markets expect the Fed to begin lowering its key borrowing rates in September and deliver two rate cuts this year against one projected by policymakers in the latest dot plot.
- Recently, the confidence of Fed officials that inflation has returned on its path to 2% has increased. June’s inflation readings showed that price pressures grew at a slower-than-expected pace. Also, monthly headline inflation deflated for the first time in more than four years.
Technical Analysis: Gold price fails to hold ground above $2,400
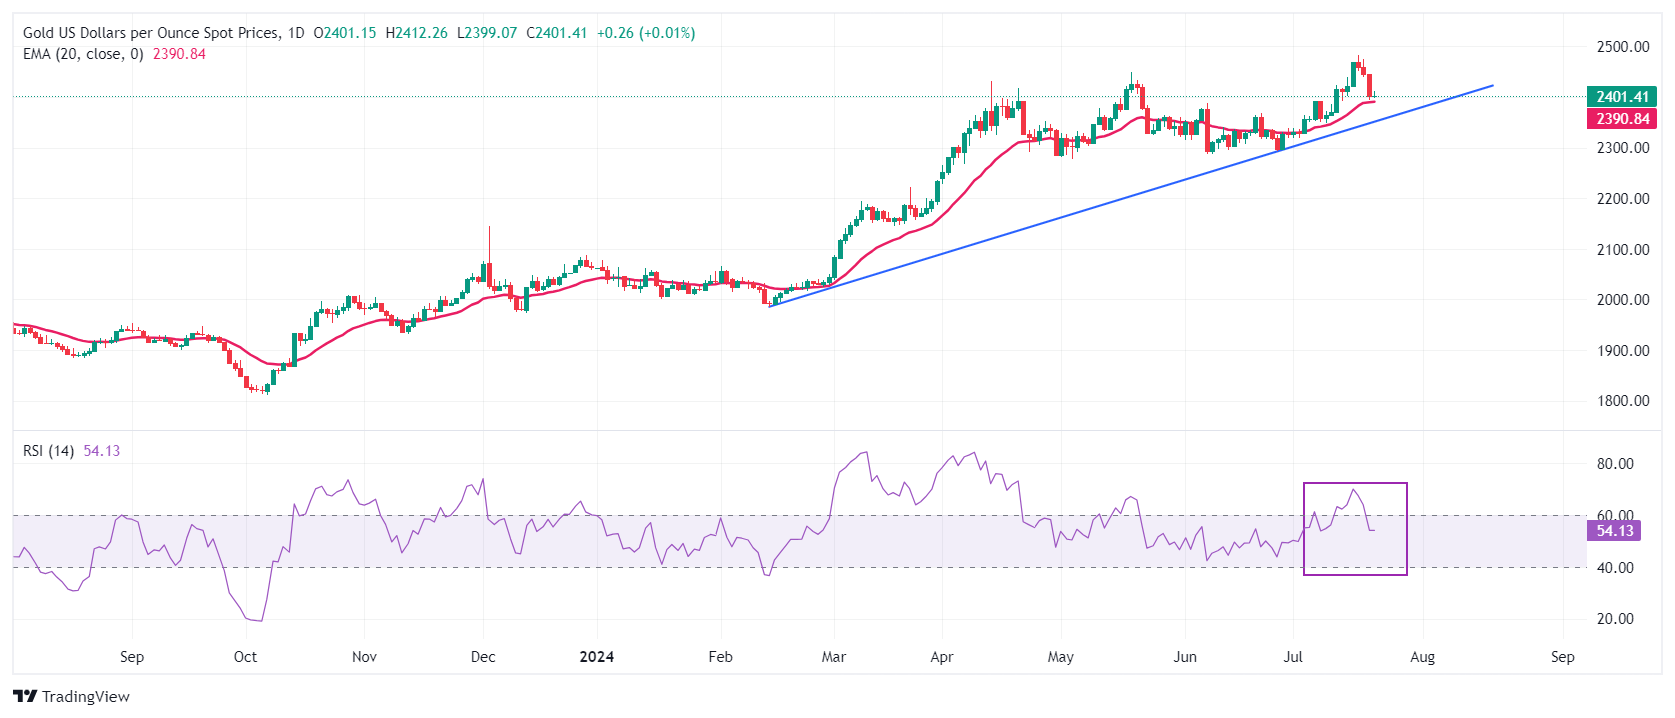
Gold price slides below the round-level support of $2,400 on Monday. The precious metal declines to near the 20-day Exponential Moving Average (EMA), which trades around $2,390, suggesting that the near-term outlook has not weakened yet technically.
Advancing trendline plotted from the February 14 low at $1,984.30 will be a major support for Gold bulls.
The 14-day Relative Strength Index (RSI) drops inside the 40.00-60.00 range, suggesting that the upside momentum has stalled. However, the upside bias remains intact.
A fresh upside would appear if the Gold price breaks above the all-time-high around $2,480.
Economic Indicator
S&P Global Composite PMI
The S&P Global Composite Purchasing Managers Index (PMI), released on a monthly basis, is a leading indicator gauging US private-business activity in the manufacturing and services sector. The data is derived from surveys to senior executives. Each response is weighted according to the size of the company and its contribution to total manufacturing or services output accounted for by the sub-sector to which that company belongs. Survey responses reflect the change, if any, in the current month compared to the previous month and can anticipate changing trends in official data series such as Gross Domestic Product (GDP), industrial production, employment and inflation. The index varies between 0 and 100, with levels of 50.0 signaling no change over the previous month. A reading above 50 indicates that the private economy is generally expanding, a bullish sign for the US Dollar (USD). Meanwhile, a reading below 50 signals that activity is generally declining, which is seen as bearish for USD.
Read more.Next release: Wed Jul 24, 2024 13:45 (Prel)
Frequency: Monthly
Consensus: -
Previous: 54.8
Source: S&P Global
Author

Sagar Dua
FXStreet
Sagar Dua is associated with the financial markets from his college days. Along with pursuing post-graduation in Commerce in 2014, he started his markets training with chart analysis.


