Gold Price Forecast: XAU/USD trades flat below $1,790 despite risk-off markets
- Gold picks up bids to renew intraday high, attacks short-term resistance.
- US Treasury yields consolidate three-day downside, stock futures and Asia-Pacific equities trade mixed.
- Omicron fears battle stimulus hopes ahead of the key central bank meetings.
- Fed December Preview: Gold stays vulnerable as Fed looks to battle inflation


Update: Gold price is trading flat to lower in Tuesday’s trading so far, with bulls limited by the $1,790 key barrier while the downside remains guarded near $1,780. The risk-off market mood puts a fresh bid under the safe-haven US dollar weighing on gold’s upside. The rapid spread of the Omicron covid variant and its potential risks to the global economy dents risk appetite.
On the other hand, the US Treasury yields remain subdued amid pre-Fed anxiety, keeping gold bulls hopeful. The Fed sentiment and Omicron updates will continue to affect the market sentiment and, in turn, the bright metal. The US PPI data will also offer some trading incentives, as the two-day Fed meeting commences on Tuesday.
Read: Covid-19 Omicron variant sinking high-beta FX
Gold (XAU/USD) rises to $1,788 in a bid to the two-day rebound during early Tuesday. The yellow metal’s recent recovery could be linked to the market’s rush to risk-safety amid multiple negatives concerning Omicron and geopolitical, not to forget cautious mood before critical central bank monetary policy meetings.
The UK’s first Omicron-linked death and return of the mask mandate in California are some of the latest updates concerning the virus strain. The same push the finance ministers and central bank governors of the Group of Seven (G7) nations to pledge more efforts to combat the COVID-19 variant and supply chain issues. Also portraying the Omicron effect is the update from the Asian Development Bank (ADB). “The ADB on Tuesday trimmed its growth forecasts for developing Asia for this year and next to reflect risks and uncertainty brought on by the new Omicron coronavirus variant,” per Reuters.
Elsewhere, the US House of Representatives and the Senate inch closer to an agreement over the Uyghur Bill aimed at China, per Bloomberg, which triggered geopolitical tensions between Washington and Beijing earlier. On the same line was the latest update from Axios saying, “White House National Security Adviser Sullivan to visit Israel next week to discuss Iran.”
It’s worth mentioning that the market chatters surrounding faster tapering of the Fed and hints to the rate hike during Wednesday’s Federal Open Market Committee (FOMC) meeting contrast the latest weakness in the US inflation expectations, providing extra support to gold prices. Recently, the global rating agency Moody’s highlights the delicate decision the US Federal Reserve (Fed) will have to make during Wednesday’s monetary policy meeting.
On the positive side, the US Democratic Party’s push to have a $1.75 trillion worth of aid package by the end of 2021 seems to favor the equities amid mixed concerns.
Against this backdrop, the US 10-year Treasury yields seesaw around 1.42% whereas the S&P 500 Futures print mild gains. Furthermore, shares in Japan, Australia, New Zealand and China trade mixed by the press time.
Moving on, gold traders should keep their eyes on the virus updates and central bank chatters for fresh impulse. That said, the US Producer Price Index (PPI) for November, expected 9.2% YoY versus 8.6% prior, may offer intraday direction.
Technical analysis
Gold extends bounce off a two-month-old horizontal support area, crossing 100-SMA amid firmer RSI and a steady Momentum line.
While the near-term momentum favors buyers, the 200-SMA and a seven-week-long resistance zone, respectively around $1,808 and $1,815 could challenge the bulls.
Should the quote rise past $1,815, odds of witnessing a run-up towards $1,834 level comprising tops marked in July and September holds the key to $1,850.
It’s worth noting that gold’s pullback move teases bearish head-and-shoulder formation, which gets confirmed on a downside break of $1,758. Following that, a theoretical south-run towards refreshing the yearly low of $1,687 lures gold sellers.
However, multiple supports around $1,770, $1,745 and $1,721 can test the metal’s downturn during fall past $1,758.
Gold: Four-hour chart
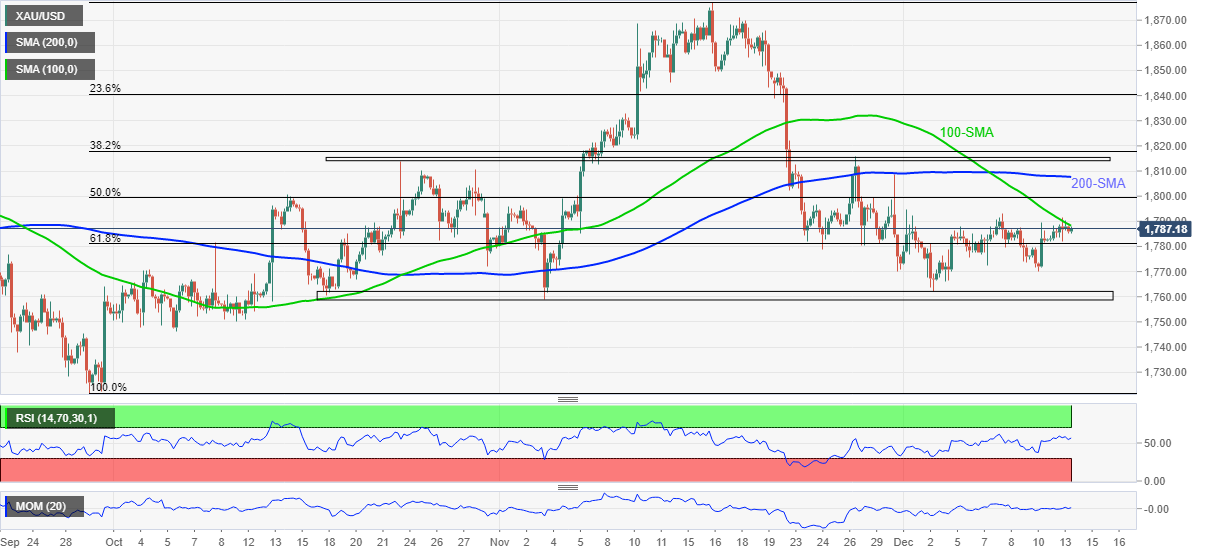
Trend: Pullback expected
Author
Anil Panchal
FXStreet
Anil Panchal has nearly 15 years of experience in tracking financial markets. With a keen interest in macroeconomics, Anil aptly tracks global news/updates and stays well-informed about the global financial moves and their implications.

















