Gold Price Forecast: XAU/USD holds in bullish territory, Russia and FOMC minutes risks ahead
- Gold consolidates the biggest daily jump in four months.
- Friday’s risk-off mood dragged yields and fuelled USD, gold prices amid escalating concerns over Russia-Ukraine war.
- Easing chatters over Fed’s 50bp rate-hike in March also weighed on bond coupons and will be watched in FOMC Minutes.
- Gold Weekly Forecast: Is gold finally regaining its inflation-hedge status?

Update: At $1,858, gold (XAU/USD) is flat in the Asian session in jittery markets at the start of the week. However, the yellow metal remains close to a 3-month peak as investors seek safety amidst warnings from the United States that Russia could invade Ukraine at any time.
Moscow has denied any plans of an invasion and has accused the West of "hysteria", despite the employment of more than 100,000 troops near Ukraine. markets are bracing for dangerous times ahead which is potentially underpinning the US dollar as well as the yellow metal. However, ''without sustained buying flow, gold prices are likely to succumb to the substantially higher real rates amid a hawkish regime at the Fed,'' analysts at TD Securities argued.
In this regard, the Federal Open Market Committee meeting minutes will be watched for the week ahead and traders will be paying particular attention to any discussions regarding near-term policy plans. Analysts at TD Securities explained that the market will be paying particular attention to plans for balance sheet normalization steps, following the release of the normalization "principles" in Jan.
End of update
Gold (XAU/USD) prices seesaw around the three-month high flashed the previous day, taking rounds to $1,860 during Monday’s quiet Asian session.
The yellow metal rallied the most since October 2021 on Friday after receding probabilities over Fed’s 0.50% rate-hike, backed by softer US data, joined widespread fears of Russia’s immediate invasion of Ukraine.
The CME FedWatch Tool suggests around 50-50 chances of 50 basis points (bps) of a Fed-rate-hike in March versus a 0.25% move. Previously, especially after the US Consumer Price Index (CPI) release, the market was almost certain of a higher boost to the rates. That said, the preliminary readings of the US Michigan Consumer Sentiment for February eased from 67.2 to 61.7 on Friday.
Elsewhere, the US warned over Moscow’s preparations for immediate war with Ukraine and urged all of its citizens to leave Kyiv. The UK and Eurozone policymakers also cited Russian preparations for an immediate war. However, the AFP News recently quoted Russian Leader Vladimir Putin saying to his French counterpart Emanuel Macron that Ukraine invasion claims are 'provocative speculation’.
Amid these plays, the US 10-year Treasury yields dropped over 11.0 basis points (bps) while Wall Street benchmarks also witnessed heavy losses due to the risk-aversion wave. The sour sentiment could also be witnessed by S&P 500 Futures that drop 0.15% intraday at the latest.
Looking forward, gold traders may await more clues from the Russia-Ukraine story and Fed’s rate-hike concerns for near-term direction. As a result, this week’s FOMC Minutes will be a crucial event to watch while also keeping eyes on geopolitics for fresh impulse.
Read: New Geopolitical Threats for 2022: Is Gold in Danger Too?
Technical analysis
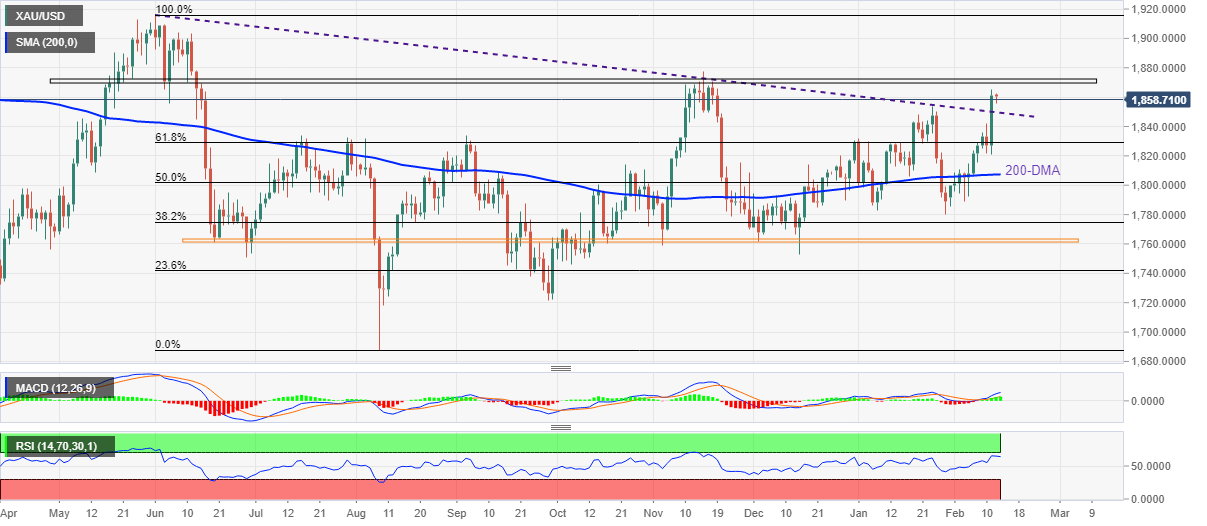
On Friday, gold prices portrayed the biggest daily jump in four months as buyers cheered escalating geopolitical tensions surrounding Russia, as well as inflation woes.
The run-up not only registered a fresh high of 2022 but also crossed a downward sloping trend line from June. Given the upbeat RSI and MACD conditions supporting the gold buyers, the latest upside has legs to run ahead.
However, a horizontal area comprising multiple levels marked since May, near $1,873, will be a crucial upside barrier for the metal to cross ahead of targeting the $1,900 threshold.
Should gold buyers keep reins past $1,900, the mid-2021 high surrounding $1,917 will be in focus.
Alternatively, an upward sloping trend line from February 03 close to $1,821 and the 200-DMA level of $1,807 restricts short-term declines of gold.
In a case where gold prices drop below $1,807, the $1,800 round figure and $1,760 will be on the seller’s radar.
Gold: Daily chart
Trend: Further upside expected
Author

Anil Panchal
FXStreet
Anil Panchal has nearly 15 years of experience in tracking financial markets. With a keen interest in macroeconomics, Anil aptly tracks global news/updates and stays well-informed about the global financial moves and their implications.