Gold Price Forecast: $1,915 in sight for XAU/USD ahead of key US Data – Confluence Detector
- Gold Price seesaws at three-week low after breaking key supports, having wide open space towards the south.
- Firmer US data, risk-off mood underpin bearish bias about XAU/USD.
- US ISM Services PMI, Federal Reserve concerns eyed for clear directions.
- Gold buyers need validation from $1,955 and softer US Dollar, yields.

Gold Price (XAU/USD) remains on the back foot at the lowest level in three weeks despite recent consolidation. In doing so, the precious metal prints a three-day losing streak amid a firmer US Dollar and risk-off mood. It’s worth mentioning that the fears of the US default joined strong US ADP Employment Change to propel the US Dollar and drown the XAU/USD the previous day.
However, the policymakers’ defense of the US Treasury bonds and hopes of witnessing upbeat US economic growth prod the Gold sellers ahead of the mid-tier US data surrounding employment and activities for July. That said, US ISM Services PMI for July and the second quarter readings of Nonfarm Productivity and Unit Labor Costs gain major attention while determining Friday’s US Nonfarm Payrolls (NFP) and the US Dollar moves.
Elsewhere, China’s upbeat Caixin Manufacturing PMI also puts a floor under the XAU/USD price and hence needs strong negatives from Beijing to keep the Gold bears hopeful.
Also read: Gold Price Forecast: XAU/USD upside appears limited amid triangle breakdown
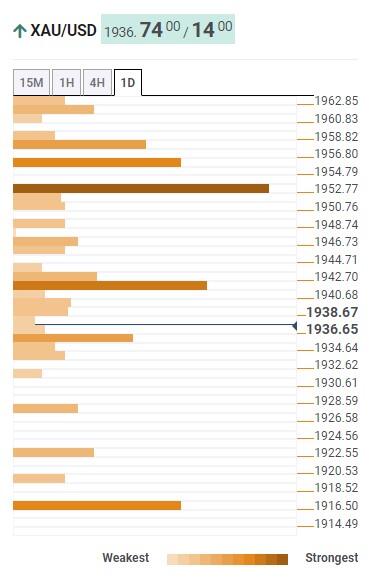
Gold Price: Key levels to watch
As per our Technical Confluence indicator, the Gold Price remains well beneath the key support-turned-resistance around $1,955 comprising the Fibonacci 23.6% on one week and the middle Band of the Bollinger on one-day. The same join the market’s favor for the US Dollar and cautious mood to add credence to the bearish bias about the XAU/USD.
It should be noted that a convergence of the previous weekly low, Pivot Point one-week S1 and Fibonacci 38.2% on one-day restricts the immediate upside of the Gold Price near $1,940.
That said, the Gold Price rally beyond $1,955 could open doors for the bull’s visit to the 100-DMA resistance of around $1,970.
On the flip side, Fibonacci 61.8% on one-month offers immediate support to the Gold Price near $1,935, a break of which appears to have an open space towards the south unless the metal hits the $1,915 support encompassing Pivot Point one-month S1 and the lower band of the Bollinger on the daily chart.
Following that, a slew of technical levels can prod the Gold sellers near $1,915 and $1,910 before directing them to the $1,900 round figure.
Here is how it looks on the tool
About Technical Confluences Detector
The TCD (Technical Confluences Detector) is a tool to locate and point out those price levels where there is a congestion of indicators, moving averages, Fibonacci levels, Pivot Points, etc. If you are a short-term trader, you will find entry points for counter-trend strategies and hunt a few points at a time. If you are a medium-to-long-term trader, this tool will allow you to know in advance the price levels where a medium-to-long-term trend may stop and rest, where to unwind positions, or where to increase your position size.
Author

Anil Panchal
FXStreet
Anil Panchal has nearly 15 years of experience in tracking financial markets. With a keen interest in macroeconomics, Anil aptly tracks global news/updates and stays well-informed about the global financial moves and their implications.


