Gold price holds above $2,300 with core PCE Inflation in focus
- Gold price rebounds from $2,315 as US Dollar comes under pressure on Monday.
- Investors see the Fed reducing interest rates twice this year.
- The US economic outlook improved as preliminary PMI expanded at a faster pace in June.

Gold price (XAU/USD) attracts bids near $2,315 in Monday’s American session as the US Dollar (USD) corrects amid firm speculation that the Federal Reserve (Fed) will deliver two rate cuts this year. The US Dollar Index (DXY), which tracks the Greenback's value against six major currencies, drops to 105.60. Expectations for the Fed to reduce interest rates twice in 2024 strengthened amid easing inflationary pressures in the United States (US).
The US Consumer Price Index (CPI) report showed that price pressures decelerated more than expected in May. Also, the preliminary S&P Global Purchasing Managers Indes (PMI) report for June showed signs of moderate cooling in cost growth. “Selling price inflation cooled to a five-month low in June. The rate of increase nevertheless fell to a five-month low in the services sector, where the rise was among the lowest seen over the past four years, and a six-month low in manufacturing,” the report said.
The CME FedWatch tool suggests that the central bank will start the policy-easing campaign at the September meeting and deliver subsequent rate cuts in November or December. The 30-day Federal Funds futures pricing data indicate that the probability of a rate cut in September is 66%.
In the early New York session, Chicago Fed Bank President Austan Goolsbee said a slowdown in inflation would open the door for policy-easing. Goolsbee said he is optimistic about further improvement in inflation data and hopes the Fed will gain more confidence in inflation heading back to 2%.
However, the Gold price could come under pressure as US bond yields have rebounded. Fed policymakers expect that interest rates will be cut only once this year, contrary to market expectations, according to the dot plot chart at the June FOMC economic projections. Officials want to see inflation declining for months before pivoting to the policy-normalization process. 10-year US Treasury yields bounced back to 4.27%. Higher yields on interest-bearing assets increase the opportunity cost of holding an investment in non-yielding assets, such as Gold.
Daily digest market movers: Gold price edges higher as US Dollar extends correction
- Gold’s price finds buying interest near $2,315 after a sharp decline on Friday. The precious metal faced an intense sell-off as the US Dollar (USD) rose after the preliminary S&P Global PMI report for June showed that economic activity unexpectedly expanded at a faster pace. The surprisingly upbeat US PMI report prompted an upside in the US Dollar, making Gold an expensive bet for currency holders.
- The report showed that the Composite PMI surprisingly jumped to 51.7. Investors expected the PMI data to decline to 51.0 from the prior release of 51.3. Chris Williamson, Chief Business Economist at S&P Global Market Intelligence, commented, “The PMI is running at a level broadly consistent with the economy growing at an annualized rate of just under 2.5%. The upturn is broad-based, as rising demand continues to filter through the economy. Although led by the service sector, reflecting strong domestic spending, the expansion is being supported by an ongoing recovery in manufacturing, which so far this year is enjoying its best growth spell for two years.”
- This week, investors will keenly focus on the revised Q1 Gross Domestic Product (GDP) data and the core Personal Consumption Expenditure price index (PCE) for May. The core PCE price index data is the Fed’s preferred inflation measure, which will provide fresh cues on when and how much the central bank will reduce interest rates this year.
- On the global front, the security pact between Russian President Vladimir Putin and North Korean leader Kim Jong-un in Pyongyang has raised the risk of further escalating geopolitical tensions. In a wide-ranging treaty spanning political, trade, investment, and security cooperation, North Korea and Russia pledged to use all available means to provide immediate military assistance in the event the other is attacked, CNN reported. Mounting global tensions could limit the downside of the Gold price.
US Dollar Price Today:
US Dollar PRICE Today
The table below shows the percentage change of US Dollar (USD) against listed major currencies today. US Dollar was the strongest against the Swiss Franc.
| USD | EUR | GBP | JPY | CAD | AUD | NZD | CHF | |
|---|---|---|---|---|---|---|---|---|
| USD | -0.36% | -0.15% | -0.16% | -0.13% | -0.13% | -0.12% | -0.06% | |
| EUR | 0.36% | 0.23% | 0.27% | 0.29% | 0.25% | 0.30% | 0.39% | |
| GBP | 0.15% | -0.23% | -0.02% | 0.05% | 0.02% | 0.07% | 0.12% | |
| JPY | 0.16% | -0.27% | 0.02% | 0.05% | 0.08% | 0.09% | 0.09% | |
| CAD | 0.13% | -0.29% | -0.05% | -0.05% | 0.00% | 0.01% | 0.07% | |
| AUD | 0.13% | -0.25% | -0.02% | -0.08% | -0.01% | 0.04% | 0.10% | |
| NZD | 0.12% | -0.30% | -0.07% | -0.09% | -0.01% | -0.04% | 0.05% | |
| CHF | 0.06% | -0.39% | -0.12% | -0.09% | -0.07% | -0.10% | -0.05% |
The heat map shows percentage changes of major currencies against each other. The base currency is picked from the left column, while the quote currency is picked from the top row. For example, if you pick the US Dollar from the left column and move along the horizontal line to the Japanese Yen, the percentage change displayed in the box will represent USD (base)/JPY (quote).
Technical Analysis: Gold price skates on thin ice above 50-day EMA
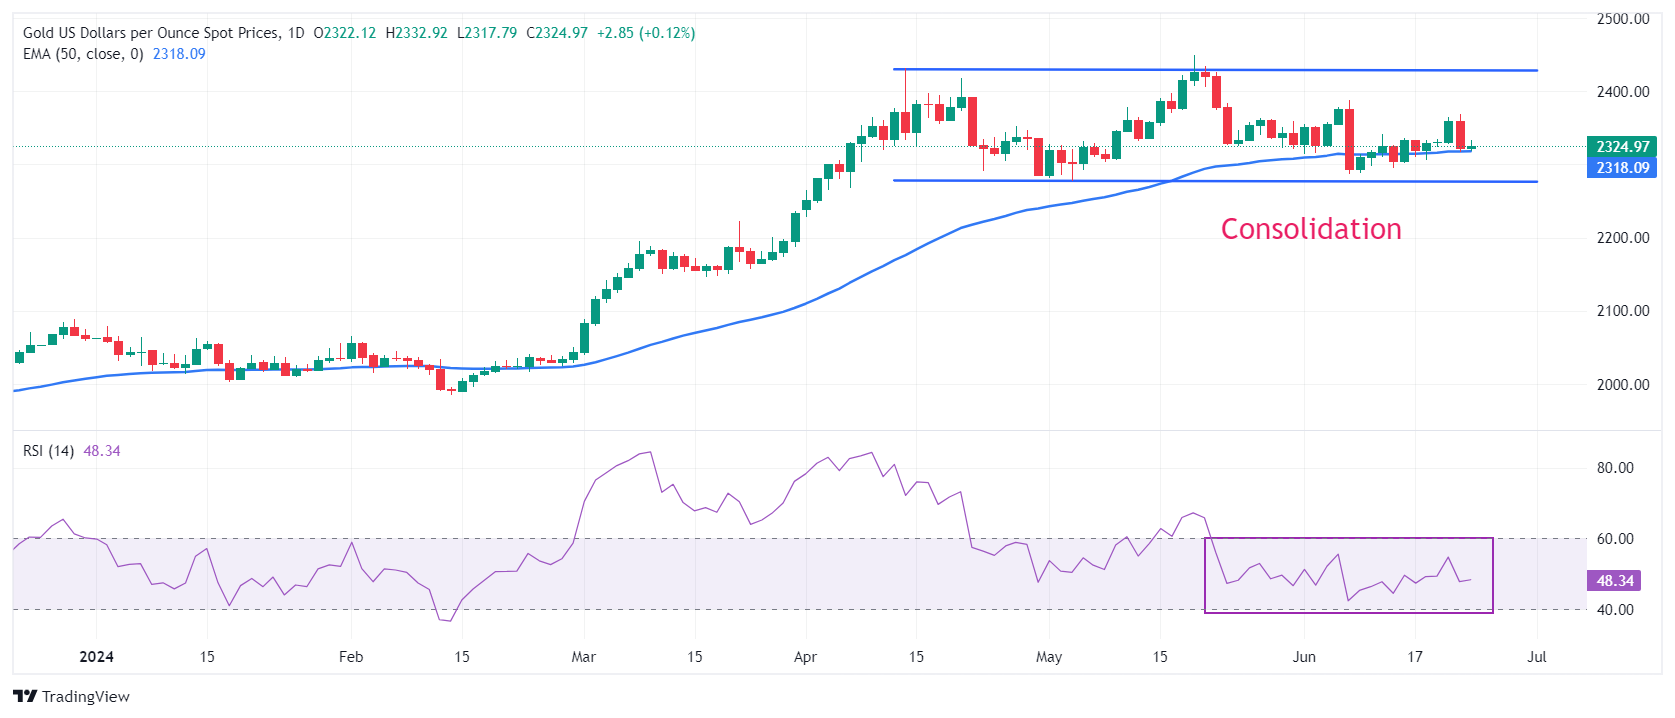
Gold price consolidates between $2,277-$2,450 for more than two months. The 50-day Exponential Moving Average (EMA) near $2,318 continues to provide support to the Gold price bulls. The 14-day Relative Strength Index (RSI) oscillates in the 40.00-60.00 range, indicating indecisiveness among market participants.
The precious metal could come under pressure if the Gold price breaks below the May 3 low around $2,277. A downside move could expose the March 21 high at $2,223. On the contrary, the Gold price could enter an unchartered trajectory if it breaks above the May 20 high of $2,450.
Economic Indicator
Core Personal Consumption Expenditures - Price Index (MoM)
The Core Personal Consumption Expenditures (PCE), released by the US Bureau of Economic Analysis on a monthly basis, measures the changes in the prices of goods and services purchased by consumers in the United States (US). The PCE Price Index is also the Federal Reserve’s (Fed) preferred gauge of inflation. The MoM figure compares the prices of goods in the reference month to the previous month.The core reading excludes the so-called more volatile food and energy components to give a more accurate measurement of price pressures. Generally, a high reading is bullish for the US Dollar (USD), while a low reading is bearish.
Read more.Next release: Fri Jun 28, 2024 12:30
Frequency: Monthly
Consensus: 0.1%
Previous: 0.2%
Source: US Bureau of Economic Analysis
After publishing the GDP report, the US Bureau of Economic Analysis releases the Personal Consumption Expenditures (PCE) Price Index data alongside the monthly changes in Personal Spending and Personal Income. FOMC policymakers use the annual Core PCE Price Index, which excludes volatile food and energy prices, as their primary gauge of inflation. A stronger-than-expected reading could help the USD outperform its rivals as it would hint at a possible hawkish shift in the Fed’s forward guidance and vice versa.
Author

Sagar Dua
FXStreet
Sagar Dua is associated with the financial markets from his college days. Along with pursuing post-graduation in Commerce in 2014, he started his markets training with chart analysis.