Gold Price Analysis: XAU/USD extends rally to multi-month highs after technical breakout
- Risk-on mood favors gold buyers amid downbeat US dollar, Treasury yields.
- Sluggish US data cools down inflation concerns, helps Fed to defend easy money policies.
- Geopolitical, covid headlines can offer intermediate moves but nothing major to keep a tab on.
- Gold Weekly Forecast: XAU/USD bulls eye $1,850 after regaining control.
- Gold Forecast: XAU/USD eyes additional upside towards $1880.
- Gold is surging again, but can prices push above 1900? [Video].
- How to Invest in Gold: Six Options to Consider.

Update May 17: After rising nearly 1% and closing the week on a firm footing on Friday, the XAU/USD pair preserved its bullish momentum on Monday and extended its rally after breaking above the critical 200-day SMA at $1,850. At the moment, the pair is rising 1.3% on a daily basis and trading at its strongest level since early February at $1,866. In the absence of significant fundamental drivers, the technical breakout seems to have fueled another leg up in gold. Meanwhile, the 10-year US Treasury bond yield is having a difficult time staging a rebound after suffering heavy losses in the second half of the previous week and helps gold continue to find demand.
Investors seem convinced that the Fed will keep interest rates low for a longer period. This, in turn, continued weighing on the US dollar and extended some support to the dollar-denominated commodity. Apart from this, a generally softer risk tone – amid worries over the continuous surge in new COVID-19 cases in Asia – further acted as a tailwind for traditional safe-haven assets, including gold.
Hence, any subsequent fall might still be seen as an opportunity for bullish traders. This further makes it prudent to wait for some strong follow-through selling before confirming that the recent positive move has run its course and placing any bearish bets around gold.
Gold Price Forecast: 17 - 21 May 2021 - WEEK AHEAD COMMODITY REPORT:
Gold is surging again, but can prices push above 1900? [Video]
Commodity prices are surging across the board with everything from the metals, energy to agriculture markets, trading near multi-year highs as the supercycle gathers pace.
Last week, Iron Ore broke $200 a ton for the first time ever. Palladium broke above $3,000 to hit a new record high and Copper prices surpassed an all-time high.
The bullish momentum also split over into the precious metals with Gold prices rising for a second straight week in a row to settle at its highest since February. While Silver prices closed the week trading near 3-months highs.
There are plenty of reasons why commodities are on the move, but the key driver is rising inflation, which has spurred significant demand for assets with inflation-hedging capabilities.
Fed’s dilemma seems priced in…
As the economies in the West rebound, inflation concerns jump back to the table as central banks and governments around the globe have pumped the system with money during the pandemic. The US Federal Reserve (Fed) has a more challenging task to defend the easy money policy after the Bank of Canada (BOC) and Bank of England (BOE) altered their bond purchases and renewed tapering talks. Also on the negative side could be expectations of further stimulus from US President Joe Biden’s table.
Even so, the market players seem to have already prepared for the Fed’s play down as the US dollar index (DXY) has been on a back foot since late March, which in turn backs the gold prices.
The greenback gauge got another jab on Friday when the US Retail Sales and Michigan Consumer Sentiment Index figures, for April and May respectively, slipped below forecast, easing the way for the Fed policymakers seeking “multiple data” to confirm the policy adjustments.
The upbeat sentiment ignored the geopolitical tussles between Israel and Palestine that recently pushed the United Nations (UN) for an emergency meeting. However, nothing important came out of the meeting, due to the US as per China. Also challenging the mood could be the headlines suggesting that China’s ban on Aussie coal import could extend into 2022.
While the S&P 500 Futures look for more push towards the north, eyeing China data dump for April, gold buyers remain hopeful as recent data from the US favor the Fed.
Against this backdrop, the Australia and New Zealand Banking Group (ANZ) said, “Whilst we give weight to re-opening and noise arguments, the evolution of core services inflation merits very close monitoring, as it makes up 60% of the US CPI. Long-term inflation expectations are also moving up, as shown in the consumer survey this week. And central banks are also increasingly concerned about frothy asset prices, as evidenced by the April ECB minutes last week. We have recently seen both the BoE and BoC start to gently dial back weekly bond purchases. Inevitably, policymakers are increasingly debating the merits versus risks of monetary policy ‘super-max’.”
Looking forward, China’s April month data dump could help the gold prices extend recent upside, should the figures cross downbeat forecasts. However, gold’s major upside may await the Fedspeak scheduled during the US session.
Gold price Technical analysis
Gold battles 200-day SMA for the first time since early February amid stronger oscillators than those dragged the quote back in the last attempt. Also favoring the gold bulls could be near-term support lines as well as the risk-on mood.
However, a clear break above the immediate $1,846-47 hurdle, comprising the key SMA, becomes necessary for the bulls before targeting the late January tops surrounding $1,875.
During the run-up, February 10 swing high near $1,855, the previous attempt to cross the 200-day SMA, could act as an intermediate halt.
Meanwhile, a two-week-old support line near $1,820 can keep the gold sellers away amid a fresh pullback, if any.
Also acting as a downside filter is an upward sloping trend line from March 31, around the $1,800 threshold.
Gold forecast daily chart
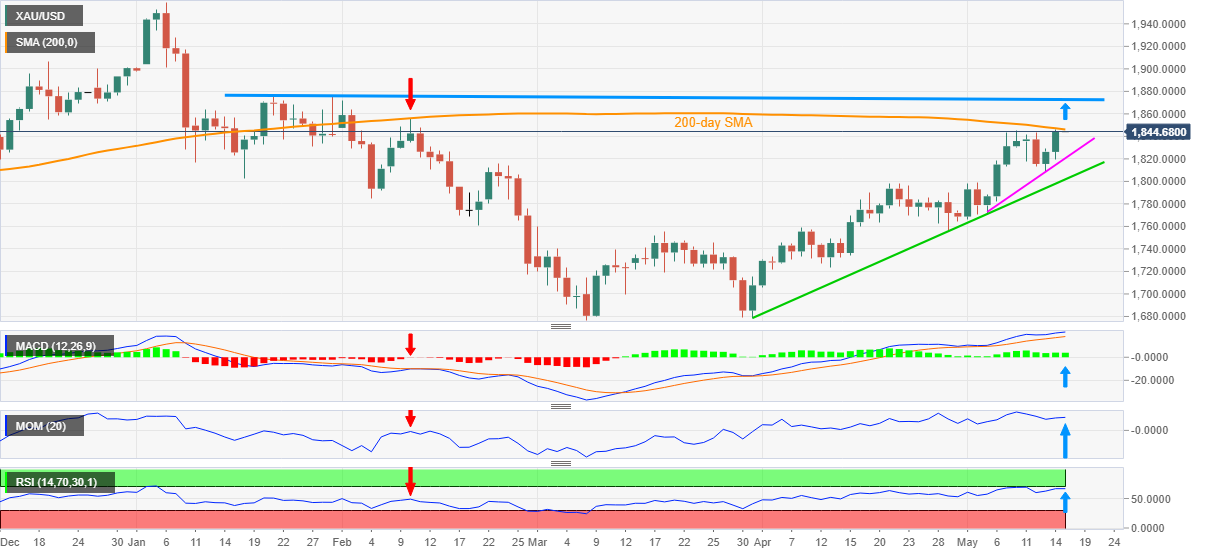
Trend: Bullish
Gold price and the 10-year US Treasury bond yield: This week economic events
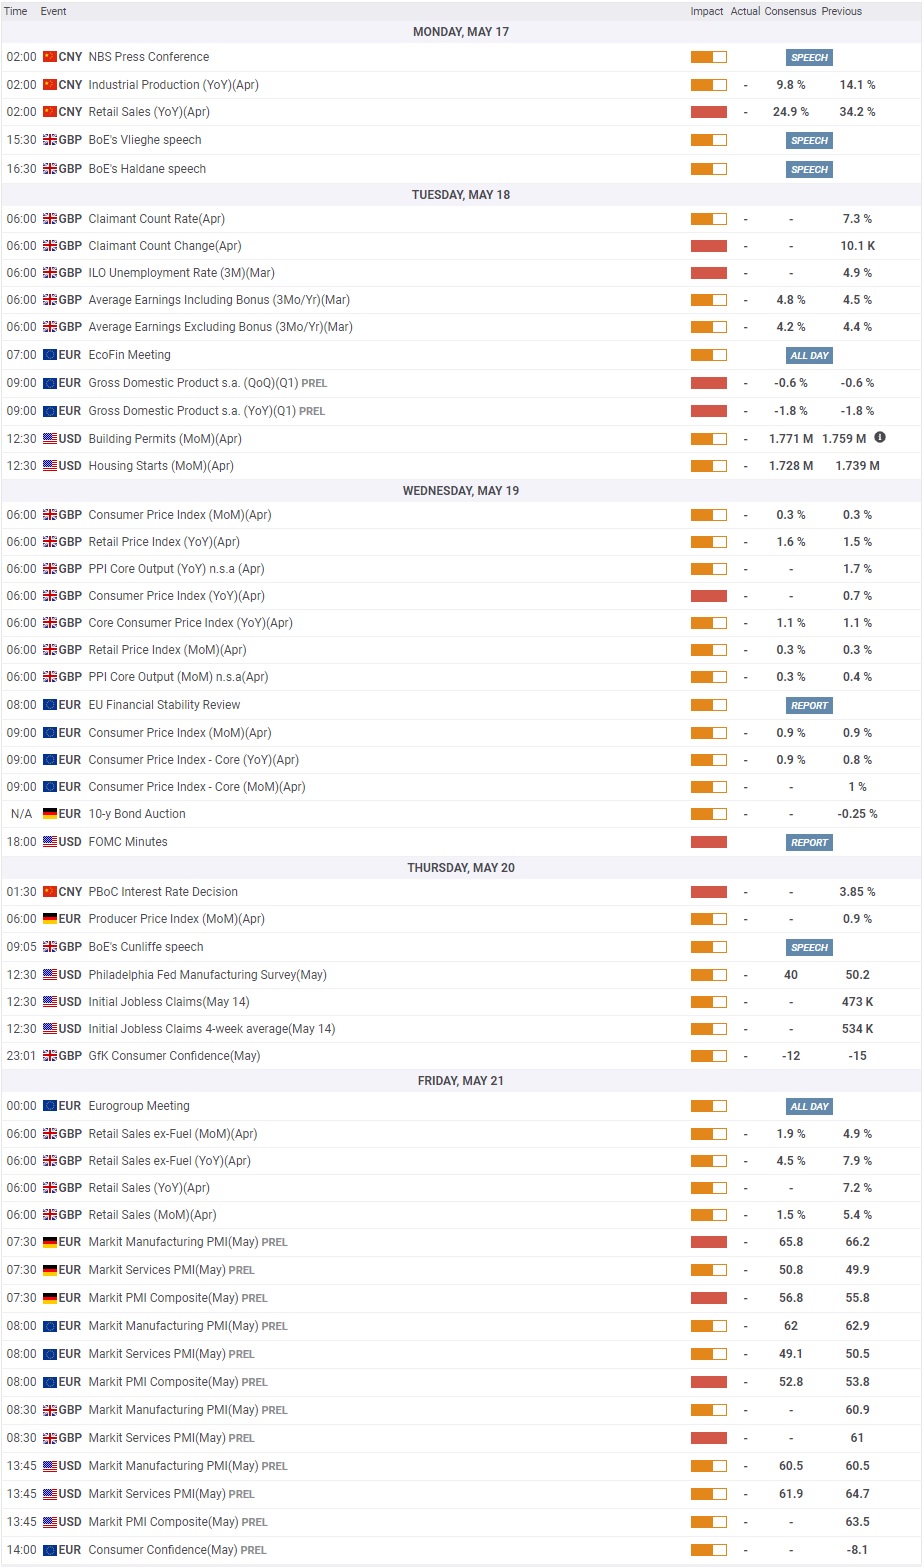
This week will be relatively quiet with regards to significant macroeconomic data releases. Industrial Production and Retail Sales data will be featured in the Chinese economic docket on Monday.
On Tuesday, market participants will keep a close eye on the first-quarter GDP data from the eurozone and the UK labour market report. On Wednesday, the CPI figures for the euro area and the UK will be released before the FOMC publishes the April Meeting Minutes at 1800 GMT.
Finally, the IHS Markit will publish the preliminary Services and Manufacturing PMI reports for the euro area, Germany, the UK and the US.
None of these events are likely to trigger a significant market reaction and investors will remain focused on developments surrounding inflation expectations. The inverse correlation between the gold price and the 10-year US Treasury bond yield is expected to remain intact.
Read: Gold Price Analysis: XAU/USD eyes additional upside towards $1880
Gold stands out with an upswing, trading above $1,850. As FXStreet’s Dhwani Mehta notes, XAU/USD’s bullish potential is intact despite the US dollar’s bounce.
US dollar dynamics and Fed speak in focus for near-term trading impetus
“Gold is benefiting from the risk-averse market conditions, thanks to the renewed worries about coronavirus restrictions in Asia. A major covid outbreak haunts Taiwan and Singapore while India and Japan struggle with rising cases and regional lockdowns.”
“Dovish Fed expectations and concerns over dwindling Chinese economic recovery also keep the bullish undertone intact in gold. Gold investors now look forward to the Fedspeak and dollar dynamics amid a quiet start to the week.”
Read: How to Invest in Gold: Six Options to Consider
Gold has long been used as a protection against inflation and as a safe haven investment. Given the current economic environment, you too may be increasingly thinking about investing in gold. So, what’s the best alternative? We discuss six options available to you.
Striking Gold with Gold Mining Stocks
There are a plethora of listed gold companies. Be aware that while a gold company’s stock price is linked to the price of gold, as it represents a major revenue stream, it is not a “pure play” on gold; it’s unlikely that a company’s value will directly replicate the price of gold...
Previous updates
Update: Gold surrendered a major part of its intraday gains to the highest level since early February and was last seen trading around the $1,846 region, nearly unchanged for the day. A goodish rebound in the US Treasury bond yields turned out to be a key factor that prompted some profit-taking around the non-yielding yellow metal. That said, a combination of factors should help limit any deeper losses amid absent relevant market moving economic releases from the US.
Update: Gold gained traction for the third consecutive session and shot to over three-month tops, around the $1,855 region during the early part of the trading action on Monday. The uptick was sponsored by a combination of factors, though slightly overbought conditions on intraday charts held bulls from placing aggressive bets.
The US dollar struggled to capitalize on its modest uptick, instead met with some fresh supply at higher levels amid dovish Fed expectations. Friday's disappointing US Retail Sales figures reinforced market expectations that the Fed will keep interest rates low for a longer period and extended some support to gold.
The USD was further pressured by the ongoing decline in the US Treasury bond yields, which was seen as another factor that acted as a tailwind for the non-yielding yellow metal. Apart from this, a softer risk tone – amid worries about the continuous surge in new COVID-19 cases in Asia – provided an additional boost to traditional safe-haven assets, including gold.
The momentum pushed spot prices beyond the very important 200-day SMA for the first time since early February and might have already set the stage for additional gains. Hence, a subsequent move beyond the $1,863-65 intermediate resistance, en-route the $1,875-76 supply zone, now looks a distinct possibility.
Update: Gold (XAU/USD) has finally cracked the 200-DMA barrier at $1846 to clinch fresh three-month tops at $1853, starting out a fresh week this Monday. The gold price extends the bullish momentum into the third straight session, shrugging off the latest bounce in the US dollar across its main competitors. Concerns over uneven economic recovery in China help underpin the sentiment around gold.
The recent strength in the gold price can be mainly attributed to the resurgent dovish Fed expectations, in light of the downbeat US Retail Sales data released last Friday. Dismal US data tamed rising inflation fears, weighing heavily on the Treasury yields, aiding the non-yielding gold. Gold traders now look forward to the FOMC minutes due for release on Wednesday for fresh direction. In the meantime, the broader market sentiment and Fedspeak will continue to influence gold prices.
Update: Gold price defies the early Asian pullback from February high, recently taking the bids to $1,848, up 0.18% intraday, during Monday. In doing so, the gold buyers benefit from the US dollar pullback while also cheering the risk-on mood portrayed on Friday.
The US dollar index (DXY) jumped 10 pips before easing to $90.39 of late. The greenback gauge might have initially cheered a lack of major data/events and the geopolitical unrest in the Middle East. However, the mixed plays between the US reflation concerns and the Fed’s defense to easy money policy seem to propel the gold prices.
Moving on, China's data dump will be the key as strong numbers from the world’s largest industrial player could renew the inflation woes and tame the gold buyers. Though, US catalysts and the Fedspeak gain a higher weight than China data when it comes to gold.
Gold bulls keep the reins around $1,848 as traders extend Friday’s risk-on sentiment amid the early Monday morning in Asia. Although recent headlines from China and the United Nations (UN) test the market optimism, receding fears of reflation back the gold buyers amid a quiet start to the key week.
Author

Anil Panchal
FXStreet
Anil Panchal has nearly 15 years of experience in tracking financial markets. With a keen interest in macroeconomics, Anil aptly tracks global news/updates and stays well-informed about the global financial moves and their implications.


