Zilliqa price rallies 20%, but the downtrend might not be over.
- ZIL price is still within a consolidative trend channel
- Zilliqa price has had severe sell-offs in the past despite bullish volume spikes
- Invalidation is a close above $0.10

Zilliqa price has rallied 20% as the bulls have printed a large bullish engulfing candle on the 4-hour chart. Still, the digital asset is steeply declining within a parallel channel. Thus, one can expect more sideways, and potential downside moves in the coming days.
Zilliqa price says to look for historical cues
Zilliqa price is currently rallying 20% since Tuesday night's low at $0.06735. Currently, the ZIL price trades at $0.08070 and looks poised to continue for higher targets. However, analyzing the overall trend, the current countertrend rally has a lot more work to do to qualify the ending of the overall downtrend for the Zilliqa price.
Zilliqa price has seen powerful rallies within the downtrend before. From April 18th to April 21st, the bulls produced a 30% rally to a high at $0.12673. A textbook ramping pattern accompanied the increase in value on the volume profile, and still, the Zilliqa price ultimately failed to breach the consolidation trend channel. The ZIL price ended up sweeping the $0.10 lows days later and continued a decline of 50%. Today is the largest countertrend price action since the 50% decline.
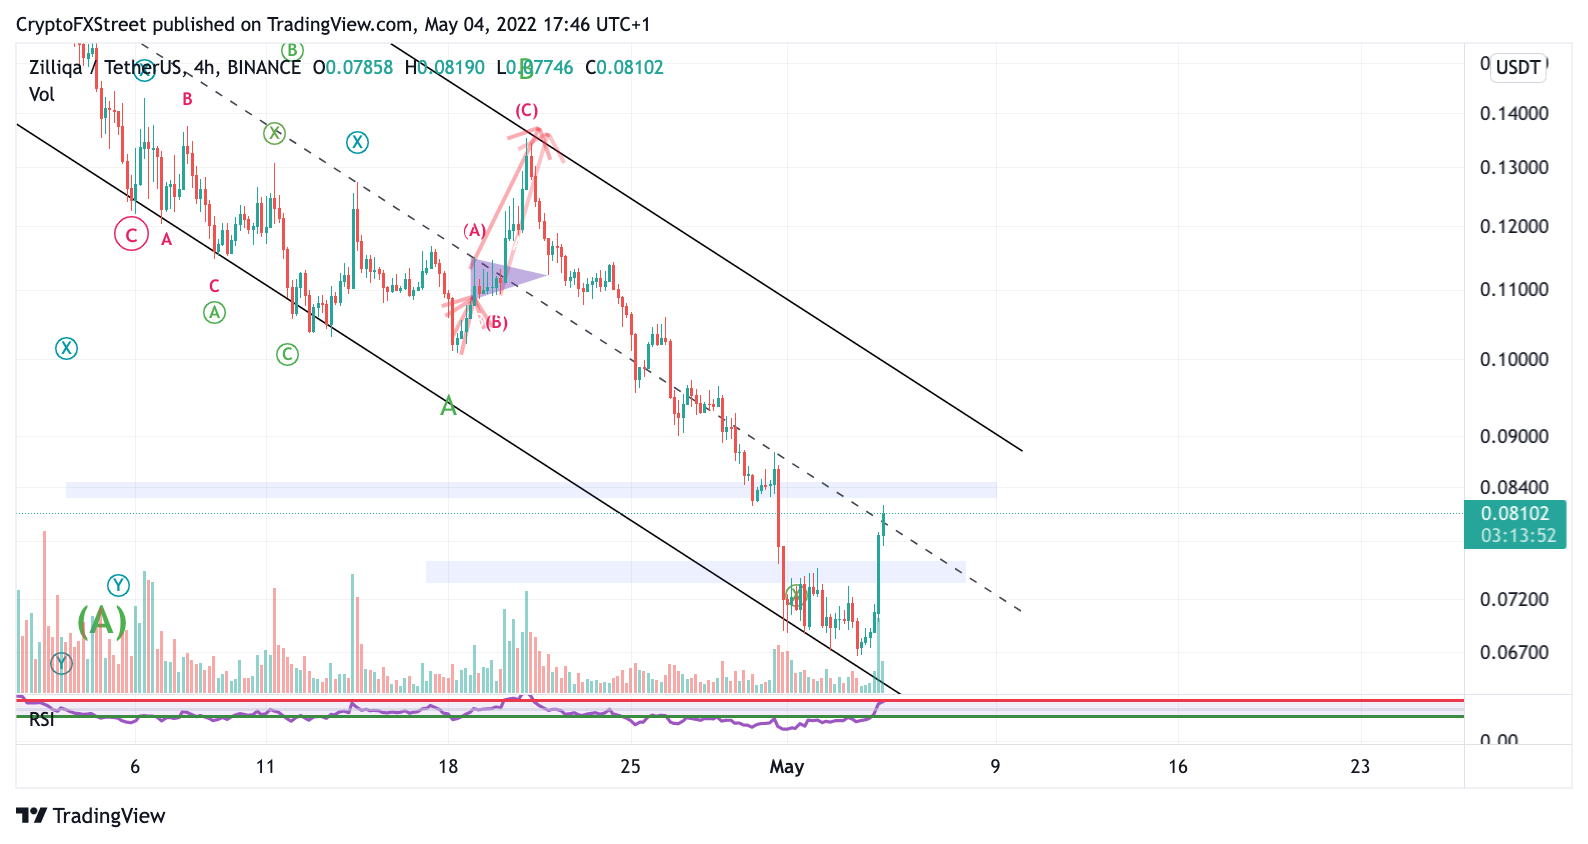
ZIL/USDT 4-Hour Chart
Traders should keep a historical outlook in mind before engaging with the ZiIliqa price action. The ZIL price does have the potential for more uptrend, but its previous April countertrend rally failure should also be a warning sign. It is worth noting that The Zil price had a more bullish volume displayed in the late April rally than the rally that is occurring now.
Invalidation of the bearish model must breach the consolidation trend line. That means ZIL price must rally an additional 25% to $0.10 and settle above the trend line before considering an end of the bearish outlook. If the bulls can accomplish said price action, the $0.13 level will be the next reliable target resulting in a 60% increase from the current Zilliqa price.
Author

Tony M.
FXStreet Contributor
Tony Montpeirous began investing in cryptocurrencies in 2017. His trading style incorporates Elliot Wave, Auction Market Theory, Fibonacci and price action as the cornerstone of his technical analysis.