This price level Zilliqa must conquer to avoid crashing to $0.08
- Zilliqa price hints at hidden bearish divergence on the 8-hour chart.
- ZIL price is failing to close above a previous swing high.
- Invalidation of the bearish case would be a break above$0.13082.

Zilliqa price could take much more time before another strong rally occurs. As of now, the ZIL price is not as promising as before.
Zilliqa price needs more strength
Zilliqa price is still experiencing relatively poor performance compared to the digital asset's strength and power in March. ZIL price has failed to close above a previous swing high for the fourth time on the 8-hour chart. This Zilliqa price action warrants the idea that the bulls are getting exhausted holding up the current $0.12 price.
On Monday, early traders to the fake-out may have purchased Zilliqa due to the parallel channel breakout. If the new buyers cannot establish a clean breakout above the previous swing high at $0.13082, the price could fall into the $0.08 zone in the coming weeks.
Zilliqa price shows hidden bearish divergence on the Relative Strength Index as the ZIL price ascends back into the $0.12 zone. The volume profile also lacks the strength seen earlier in March that first brought the Zilliqa price into this price level.
Traders should avoid getting too overzealous with the Zilliqa price and consider other digital assets for better returns. The ZIL chart pattern could get very complex in the coming weeks.
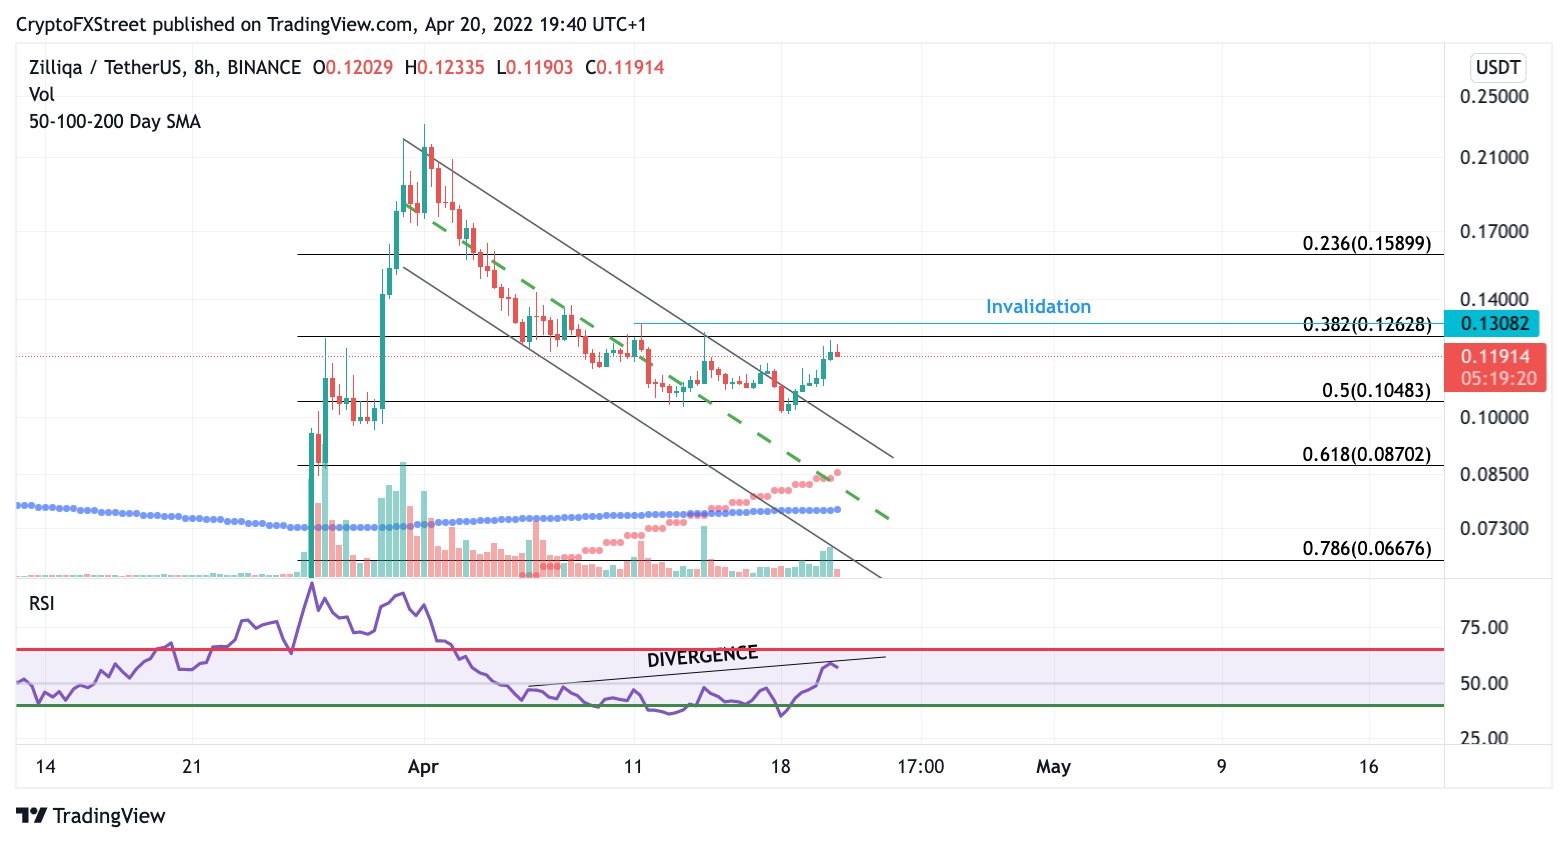
ZIL/USDT 8-Hour Chart
Invalidation for the downtrend scenario will be a clean breakout above $0.13082. If this scenario occurs, traders will look for an entry on a pullback as the ZIL price could target the $0.16 and $0.17 zone, resulting in up to a 40% increase from the current Zilliqa price.
Author
FXStreet Team
FXStreet
Composed of a group of economic journalists and FX experts, the FXStreet content team produces and oversees all content published on FXStreet. It provides a purely journalistic approach to the Forex market.


