Zilliqa Price Prediction: ZIL to resume uptrend but first must regain $0.08 as support
- Zilliqa price broke out of an inverse head and shoulders pattern on the weekly chart.
- The digital asset seems to be poised for a short-term correction before resuming uptrend.

In November 2020, Zilliqa saw a massive breakout from an inverse head and shoulders pattern on the weekly chart touching $0.036 and seeing a ton of continuation within the next month, to reach a high of $0.106 on December 21, 2020.
Zilliqa price has to climb above $0.08 to rise towards $0.36
After what seems to be a breakout above the neckline of an inverse head and shoulders pattern on the weekly chart, Zilliqa bulls targetted $0.36 in the long-term, however, they have encountered some short-term resistance at $0.106.
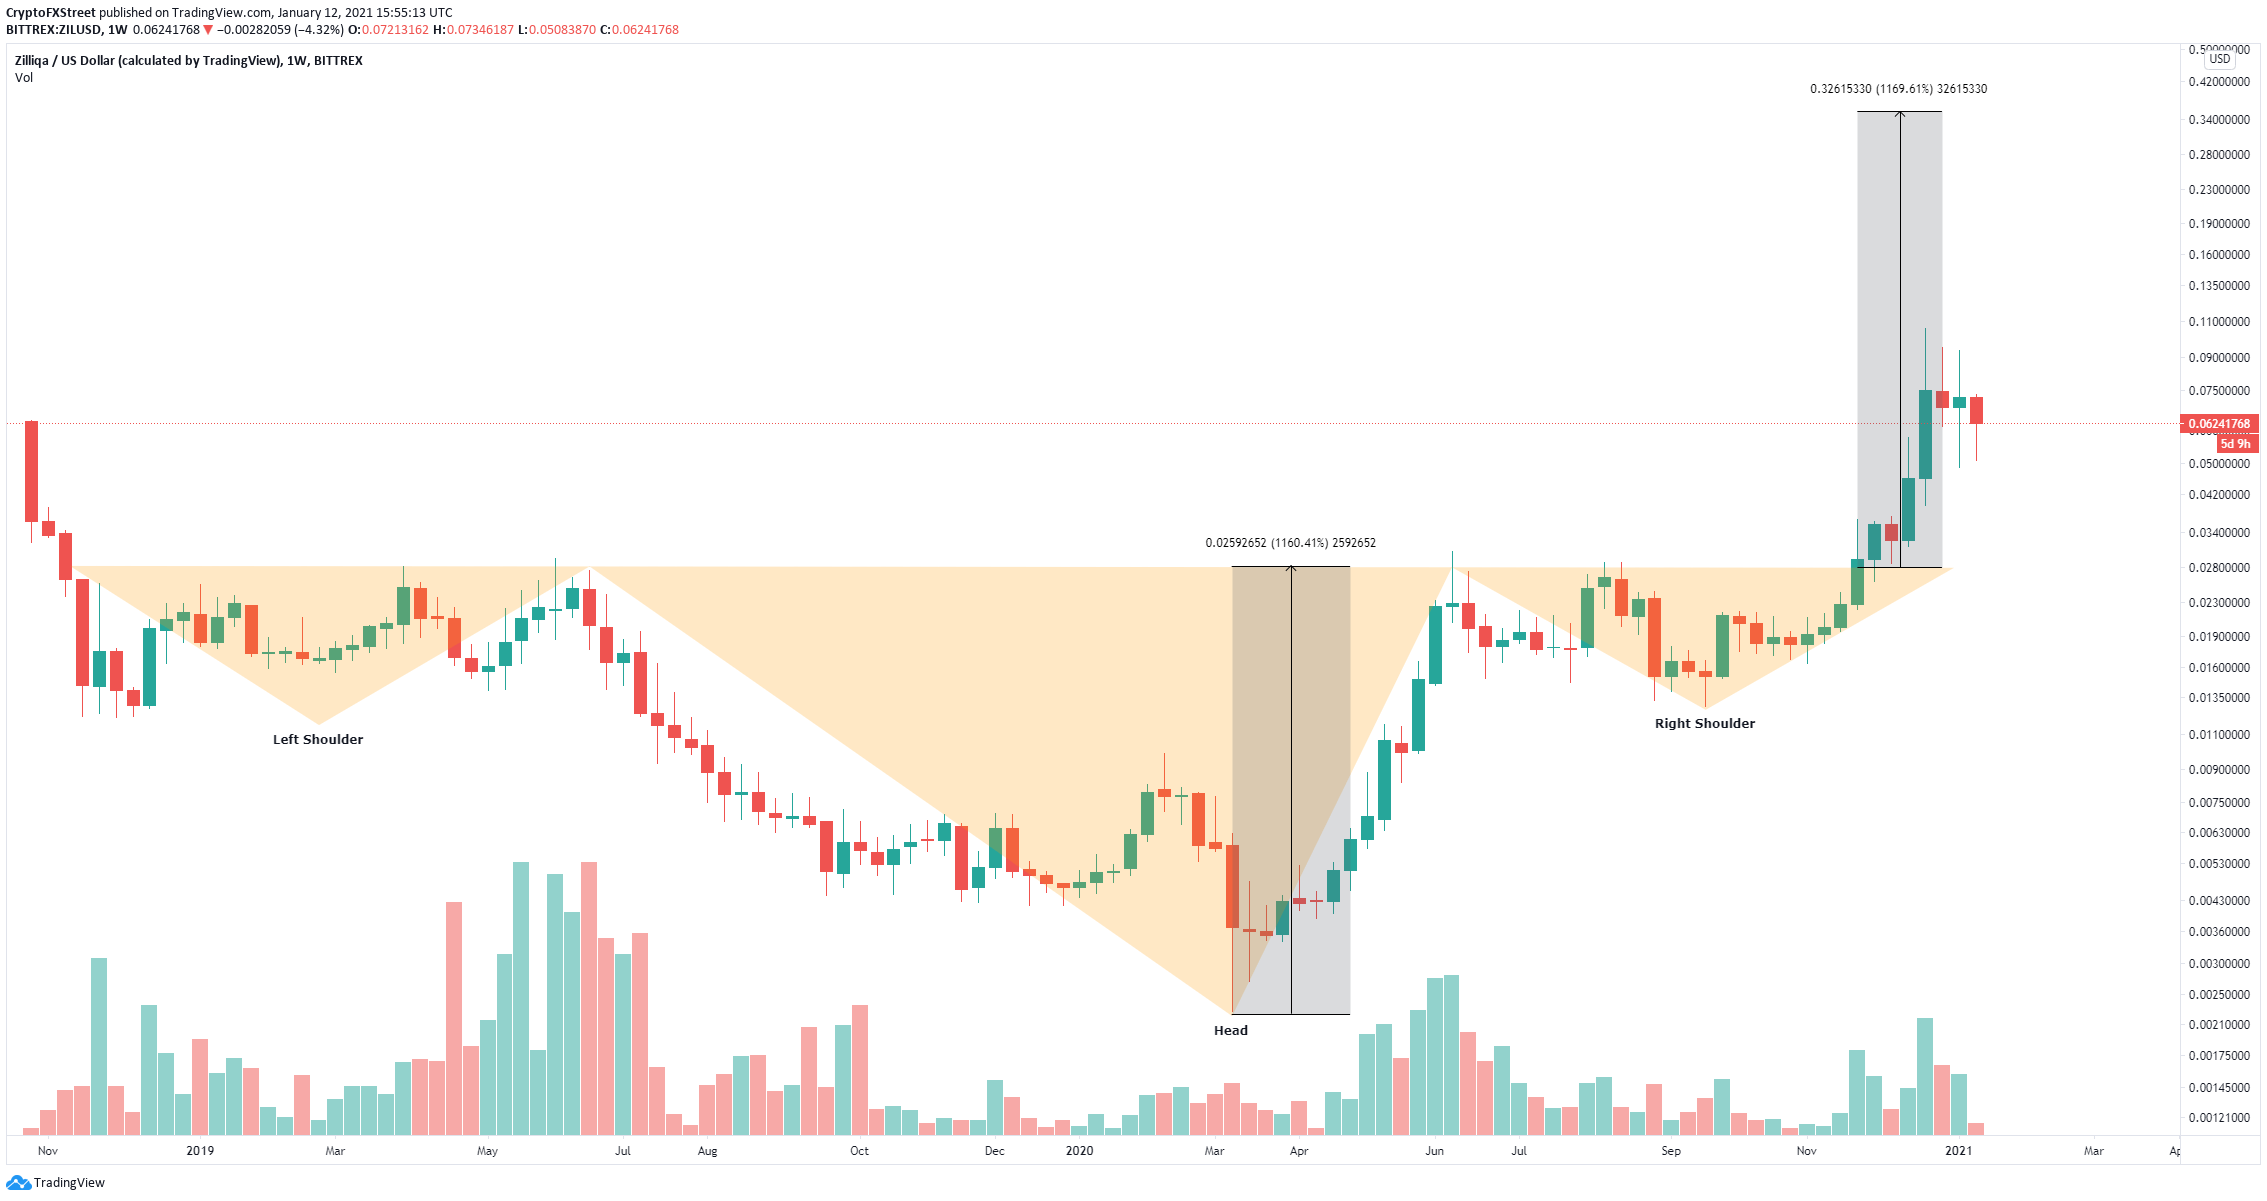
ZIL/USD weekly chart
After a breakout of this type of pattern, the price of an asset usually comes back down to re-test the previous resistance level which should act as a support, in this case, the $0.028 level.
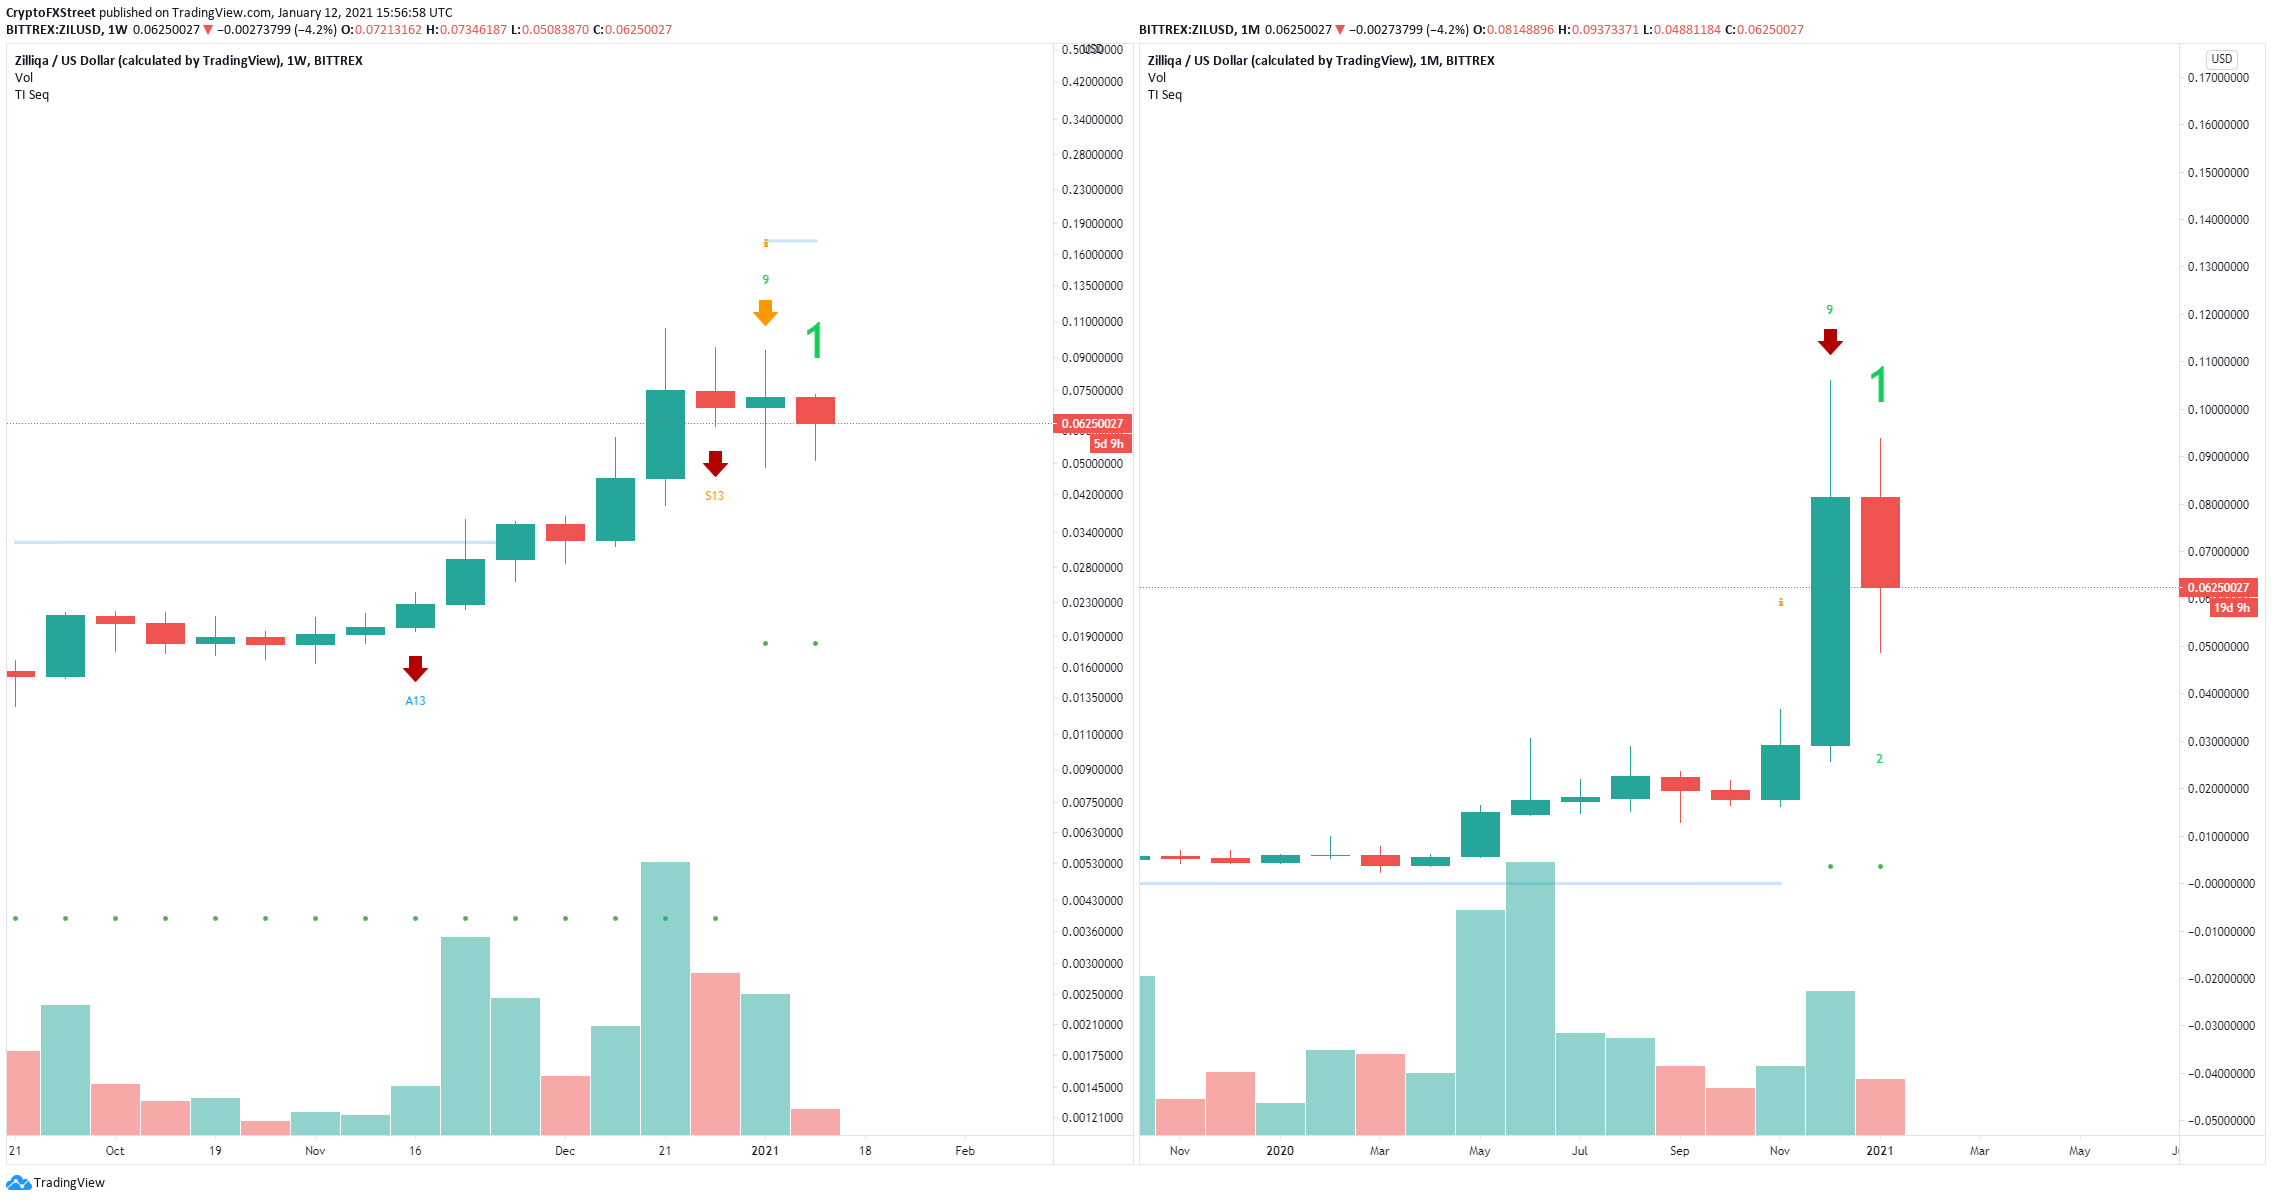
ZIL sell signals
The TD Sequential indicator has presented a sell signal on the weekly chart and the monthly chart which adds a lot of credence to the bearish outlook. The bearish price target would be $0.028 which is the neckline of the head and shoulders pattern.
#Zilliqa still doing what I thought it would do -> consolidating after the impulse wave.
— Michaël van de Poppe (@CryptoMichNL) January 12, 2021
First level of interest hit at $0.055 and most likely constructing a range-bound period just like the previous period.
In the end very bullish outlook for this one for 2021. pic.twitter.com/aam5FTXPrA
According to popular cryptocurrency and stock trader, Michale van de Poppe, Zilliqa price was bound for a correction and will now trade inside a tight range before another breakout above the previous high. Van Poppe states Zilliqa remains bullish in the long-term.
Author

Lorenzo Stroe
Independent Analyst
Lorenzo is an experienced Technical Analyst and Content Writer who has been working in the cryptocurrency industry since 2012. He also has a passion for trading.


