- Zilliqa price is bounded inside a descending triangle pattern on the hourly chart.
- The digital asset experienced a fakeout and managed to recover but remains highly indecisive.
Zilliqa had a violent 6% drop below a critical support level at $0.074 from which it recovered within the next 30 minutes. Despite the recovery, the direction of the trend is still not clear.
Zilliqa price shows bearish and bullish signs at the same time
The breakdown below the critical support level at $0.074 seemed like a clear bearish sign. However, bulls managed to buy the dip and pushed Zilliqa up to $0.079 before plummeting again down to $0.074.
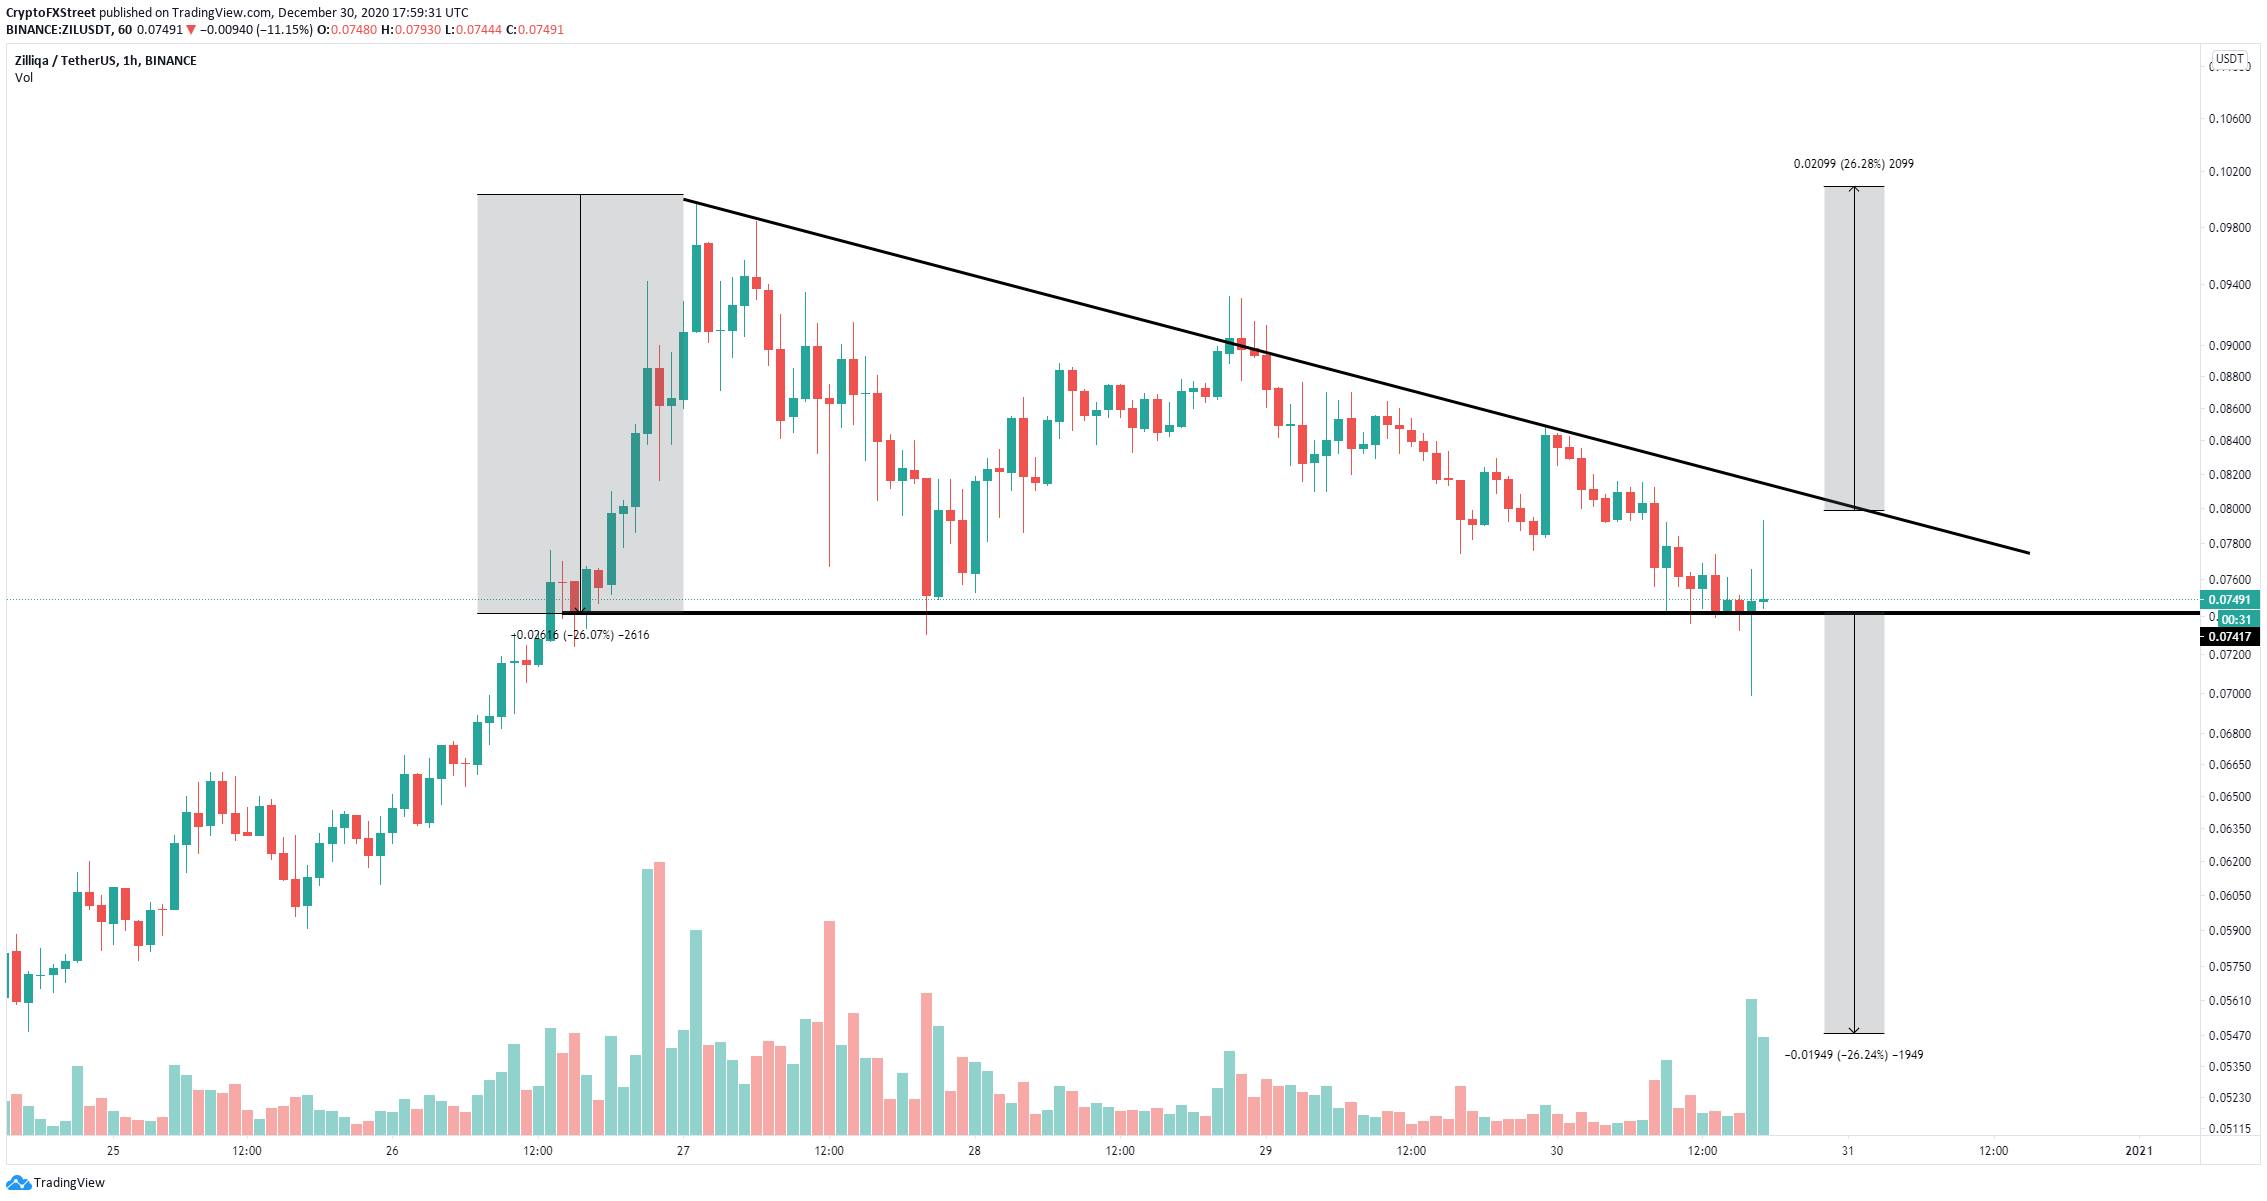
ZIL/USD 1-hour chart
The past two hourly candlesticks show that investors are indecisive. A breakdown and close below $0.074 would push Zilliqa price down to $0.055, which is a 26% drop calculated using the height of the descending triangle pattern.
However, it’s also entirely possible for the bulls to push Zilliqa price up to the resistance level at $0.08, which is the upper boundary of the pattern. A breakout above this point would drive ZIL towards a high of $0.1.
Note: All information on this page is subject to change. The use of this website constitutes acceptance of our user agreement. Please read our privacy policy and legal disclaimer. Opinions expressed at FXstreet.com are those of the individual authors and do not necessarily represent the opinion of FXstreet.com or its management. Risk Disclosure: Trading foreign exchange on margin carries a high level of risk, and may not be suitable for all investors. The high degree of leverage can work against you as well as for you. Before deciding to invest in foreign exchange you should carefully consider your investment objectives, level of experience, and risk appetite. The possibility exists that you could sustain a loss of some or all of your initial investment and therefore you should not invest money that you cannot afford to lose. You should be aware of all the risks associated with foreign exchange trading, and seek advice from an independent financial advisor if you have any doubts.
Recommended Content
Editors’ Picks

Top 3 Price Prediction Bitcoin, Ethereum, Ripple: BTC consolidates while ETH and XRP show some strength
Bitcoin (BTC) consolidated between $94,000 and $100,000 in the last nine days. Ethereum (ETH) and Ripple (XRP) prices stood relatively stronger and have gained nearly 3% and 7%, respectively, this week.

Trump's US reciprocal tariffs pause fails to improve Bitcoin and crypto market outlook
Bitcoin (BTC) and top cryptos halted their declines following a pause in President Donald Trump's reciprocal tariff plans, which were originally scheduled to go live on Thursday.

Ripple vs SEC battle nears end as the regulator acknowledges Grayscale XRP ETF filing
Ripple's XRP is up 4% in the early hours of Friday following the Securities and Exchange Commission (SEC) acknowledgment of Grayscale's 19b-4 filing to convert its XRP Trust to an ETF.

200,000 New Investors Buy Ripple (XRP) 30-Days After Gensler’s Farewell: What Next for Stellar (XLM)?
Ripple (XRP) price consolidated around $2.40 on Thursday, up 11% since Monday, technical indicators suggest Stellar (XLM) has joined the rally.

Bitcoin: BTC consolidates before a big move
Bitcoin's (BTC) price has been consolidating between $94,000 and $100,000 for the last ten days, and, when writing on Friday, it hovers around $97,000. Despite this consolidation, US Bitcoin spot Exchange Traded Funds (ETFs) data recorded a total net outflow of $650.80 million until Thursday, hinting signs of weakness among institutional investors.

The Best Brokers of the Year
SPONSORED Explore top-quality choices worldwide and locally. Compare key features like spreads, leverage, and platforms. Find the right broker for your needs, whether trading CFDs, Forex pairs like EUR/USD, or commodities like Gold.