Zilliqa price momentum wanes, putting new all-time highs on hold
- Zilliqa price tagged the 2018 high this week.
- Daily Relative Strength Index (RSI) shows bearish momentum divergence.
- Deep range of support is just below current price.

Zilliqa price cleared the neckline of a massive head-and-shoulders bottom pattern in November 2020, resulting in a 630% rally at Monday’s high. This rally has captured support at the 50-day simple moving average (SMA) on every pullback over the last three months. However, all trends need a structural reset, and resistance at the all-time high will likely be the catalyst to initiate a deeper correction.
Zilliqa price correction will be cyclical, not secular
The bearish momentum divergence on the daily charts combined with a head-and-shoulders top pattern on the weekly RSI should raise caution amongst ZIL traders, despite trading near all-time highs. A break below the weekly RSI neckline will be the first confirmation that the correction is gaining traction.
ZIL has a range of support between $0.166 and $0.105 that encompasses the 50 and 100-day SMAs. If the advance is to follow historical precedent, the digital token should discover heavy support at the 50-day SMA, currently at $0.153. It would represent an 18.5% decline from the current price.
However, suppose ZIL is going to launch a successful rally above the all-time high at $0.235. In that case, price needs a deeper correction to hammer the RSI into an oversold condition, thereby generating a bull market reset. A fair target for a reset is the 100-day SMA at $0.117, producing a 38.5% decline from the current price.
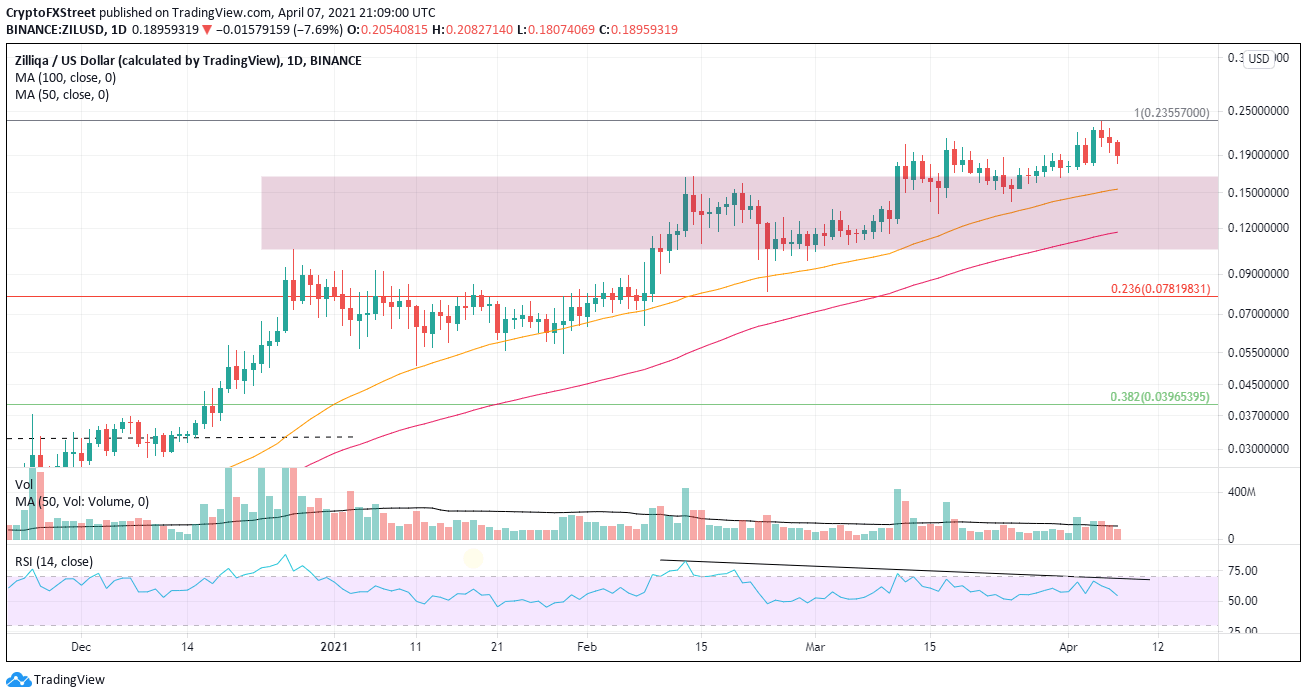
ZIL/USD daily chart
Cryptocurrencies have a unique volatility profile, and as a result, traders need to respect the alternative scenario for any market projection. In this case, ZIL may print a marginal new high, or it may define a tight pennant pattern just under the 2018 high, much like the price action of Cardano (ADA) at the time of writing.
Traders should evaluate upside targets after a weekly close above the all-time high at $0.235.
Author

Sheldon McIntyre, CMT
Independent Analyst
Sheldon has 24 years of investment experience holding various positions in companies based in the United States and Chile. His core competencies include BRIC and G-10 equity markets, swing and position trading and technical analysis.


