Zilliqa Price Projection: ZIL is primed for a 35% decline to $0.10
- Zilliqa price near all-time high at $0.235.
- Relative Strength Index (RSI) has shaped a bearish head-and-shoulders top.
- Historical precedent contradicts the bullish narrative.

Zilliqa price has rallied 10,000% since March 2000 in a staircase shape to the most recent high at $0.211. Each leg higher has been followed by a 53% decline on average, of which the last two found support at the 10-week simple moving average (SMA). With the RSI carving out a head-and-shoulders top and historical precedent in favor of continuing this decline, ZIL could fall another 35% from current levels.
Zilliqa price not finding a bid as the all-time high looms
In December 2020, ZIL broke out from a bullish head-and-shoulders bottom, and it has held the 10-week SMA the entire rally. Volume has not been complimentary, excluding the first couple of weeks following the breakout; volume has been at or below average. Not what traders want to see at new rally highs.
Technical patterns can form on indicators as well as price, with the RSI shaping a bearish head-and-shoulders top in the weekly chart. A break below the neckline will likely proceed price, alerting traders to flip to the short side.
The first significant support is the 10-week SMA at $0.1204. Below is the 53% decline target from the most recent high at $0.099, representing a decline of 35% from current levels and 18% below the 10-week SMA.
A panic sell-off would drive ZIL down to the 40-week SMA at $0.052 and potentially to the 0.382 Fibonacci retracement level at $0.037.
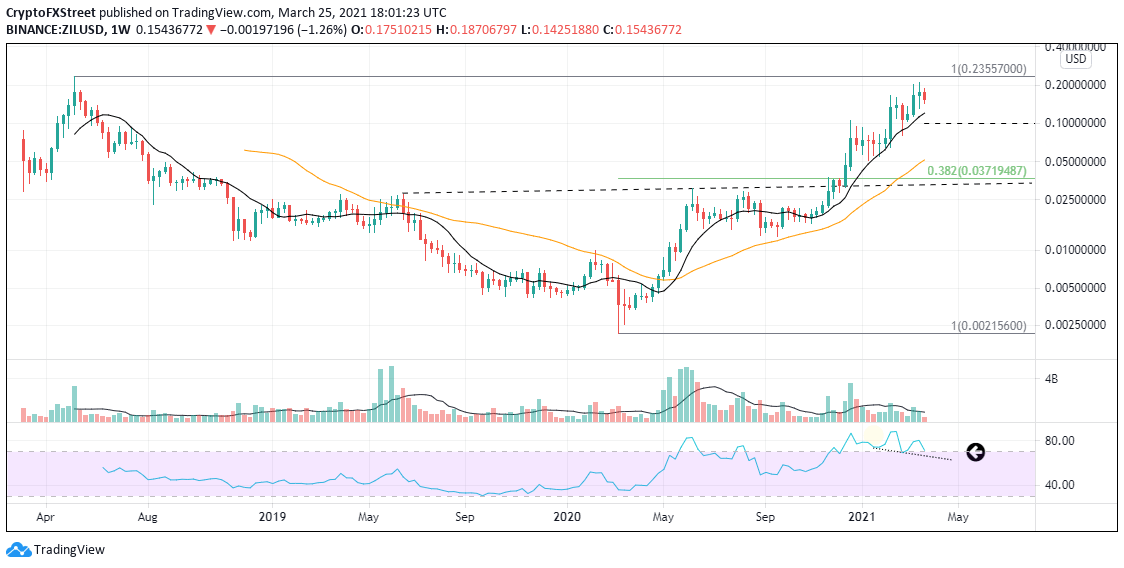
ZIL/USD weekly chart
Considering the overbought condition on the RSI, the best that bulls can hope for in the short-term is a test of this week’s high at $0.187.
Author

Sheldon McIntyre, CMT
Independent Analyst
Sheldon has 24 years of investment experience holding various positions in companies based in the United States and Chile. His core competencies include BRIC and G-10 equity markets, swing and position trading and technical analysis.


