XRP price shows a massive influx of active wallets, should Investors be concerned?
- Ripple’s active addresses have increased by nearly 6x on multiple sets of occasions throughout the summer.
- Ripple price hovers just above a breached consolidative barrier, which is enticing traders to open a long positions.
- Invalidation of the bearish view demands $0.48 holds as resistance.

XRP price is displaying optimistic technicals during the second trading week of August. Still, the odds of a Wall Street trap remain on the table.
XRP price could be a Wall Street trap
XRP price currently auctions at $0.38 as the bulls have successfully breached a consolidative trend line. The display is quite monumental as the descending barrier has played a significant role on the XRP price since April 2022. Traders witnessing the breach should be drawing up trading plans as the technicals present a promising future.
Still, some on-chain metrics do not necessarily correlate with the bullish price action. Santiment’s Active Wallet’s indicator shows concerning signals amids the current 33% bull run since the June 18 lows at $0.28.
On multiple occasions the indicator shows a significant influx of active wallets. This could be viewed as a contrarian bearish and merits reasonable doubt in the current Ripple uptrend. Perhaps Smart Money has been sneakishly placing sell limits while retail consume.
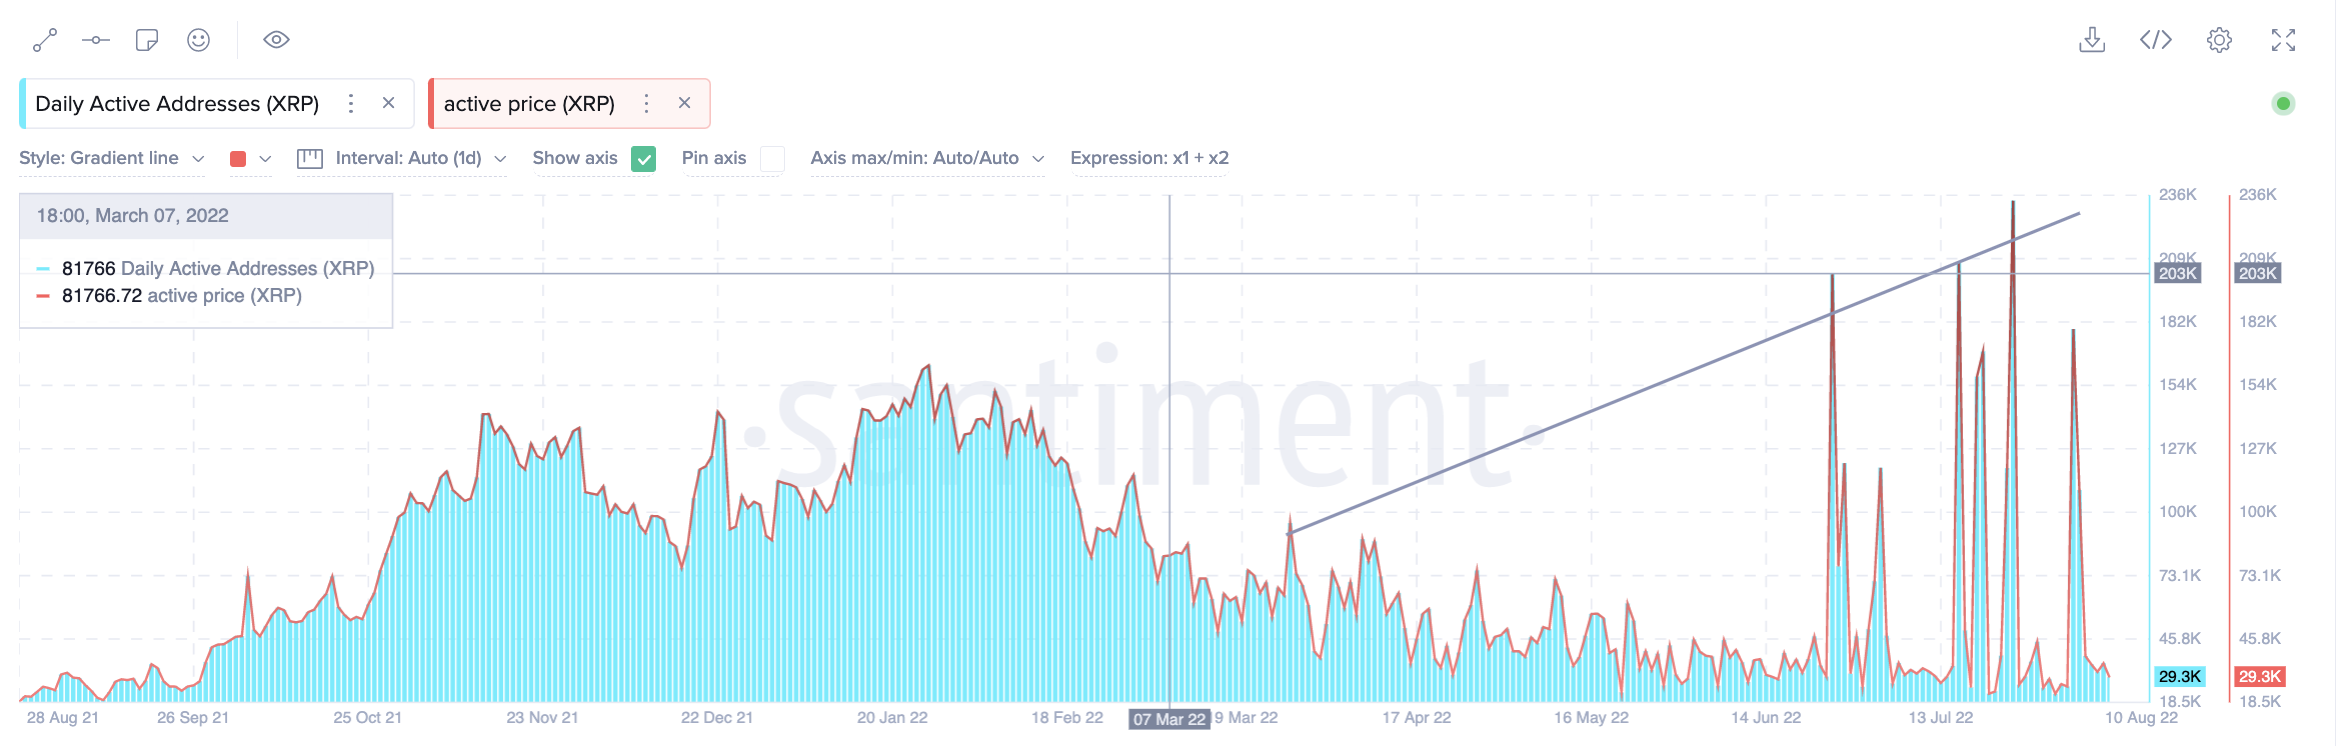
Santiment Active Wallet Indicator
Ripple price looks bullish in the short term and previous outlooks have already been issued identifying key levels for bullish traders. Nonetheless a Smart money trap is still at play. Bears looking to place a bet can use the $0.48 barrier as a definitive line in the sand. If the bears conquer the trend, a breach towards $0.24 could occur, resulting in a 35% decline from the current XRP price.
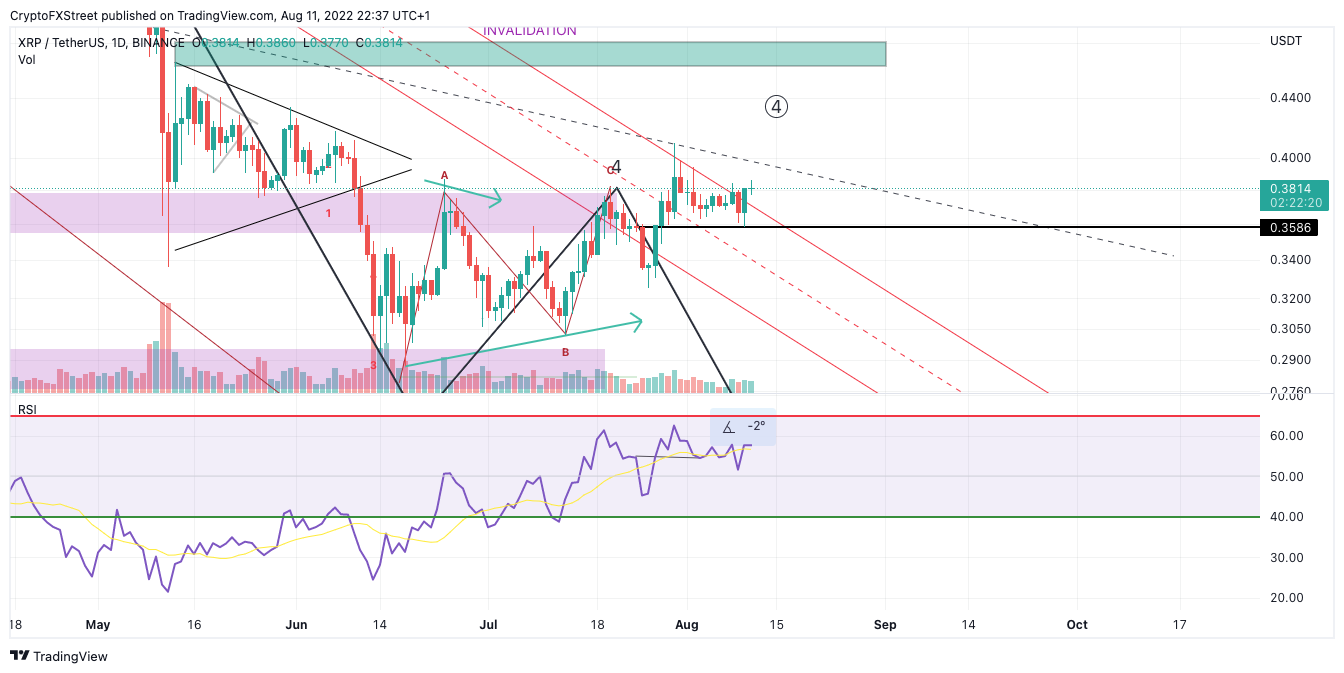
XRP/USDT 1-Day Chart
In the following video, our analysts deep dive into the price action of Ripple, analyzing key levels of interest in the market. -FXStreet Team
Author

Tony M.
FXStreet Contributor
Tony Montpeirous began investing in cryptocurrencies in 2017. His trading style incorporates Elliot Wave, Auction Market Theory, Fibonacci and price action as the cornerstone of his technical analysis.


