XRP price reveals Ripple bulls big picture plans for holders and it includes 50% rally
- XRP price shows a clear domination of bears after an 18% crash between April 18 and 21.
- The four-hour chart shows key accumulation levels before Ripple bulls kick-start a massive 50% uptrend.
- A failure to hold above the $0.396 level will signal a weakness in buyers’ strength and potentially invalidate the bullish thesis.

XRP price has been hovering inside a larger range, as mentioned in previous publications. The recent bull rally pushed it to retest the range high. However, as momentum exhausted and investors resorted to profit-taking, the gains came undone, and Rippl returned to the mean.
In this article, we will take a look at the short-term and long-term outlook for XRP price and potential accumulation levels for the long run.
Also read: Top 3 Price Prediction Bitcoin, Ethereum, Ripple: Crypto markets await BTC’s cue
XRP price ready to take control
XRP price has bounced nearly 8% after the recent 18% decline between April 18 and 21. This move indicates that the bears are slowly giving away control. A minor pullback is likely to be followed by an extension of this recovery rally to $0.489, which is the midpoint of the 18% descent. In some cases, Ripple bulls could continue their ascent and tag the $0.512 hurdle.
This is the short-term outlook for XRP price and provides scalpers and day traders with some good opportunities.
However, if XRP price manages to flip the $0.537 hurdle, it will signal a breakout from a major high timeframe level. In such a case, investors need to focus on the three-day chart of XRP price.
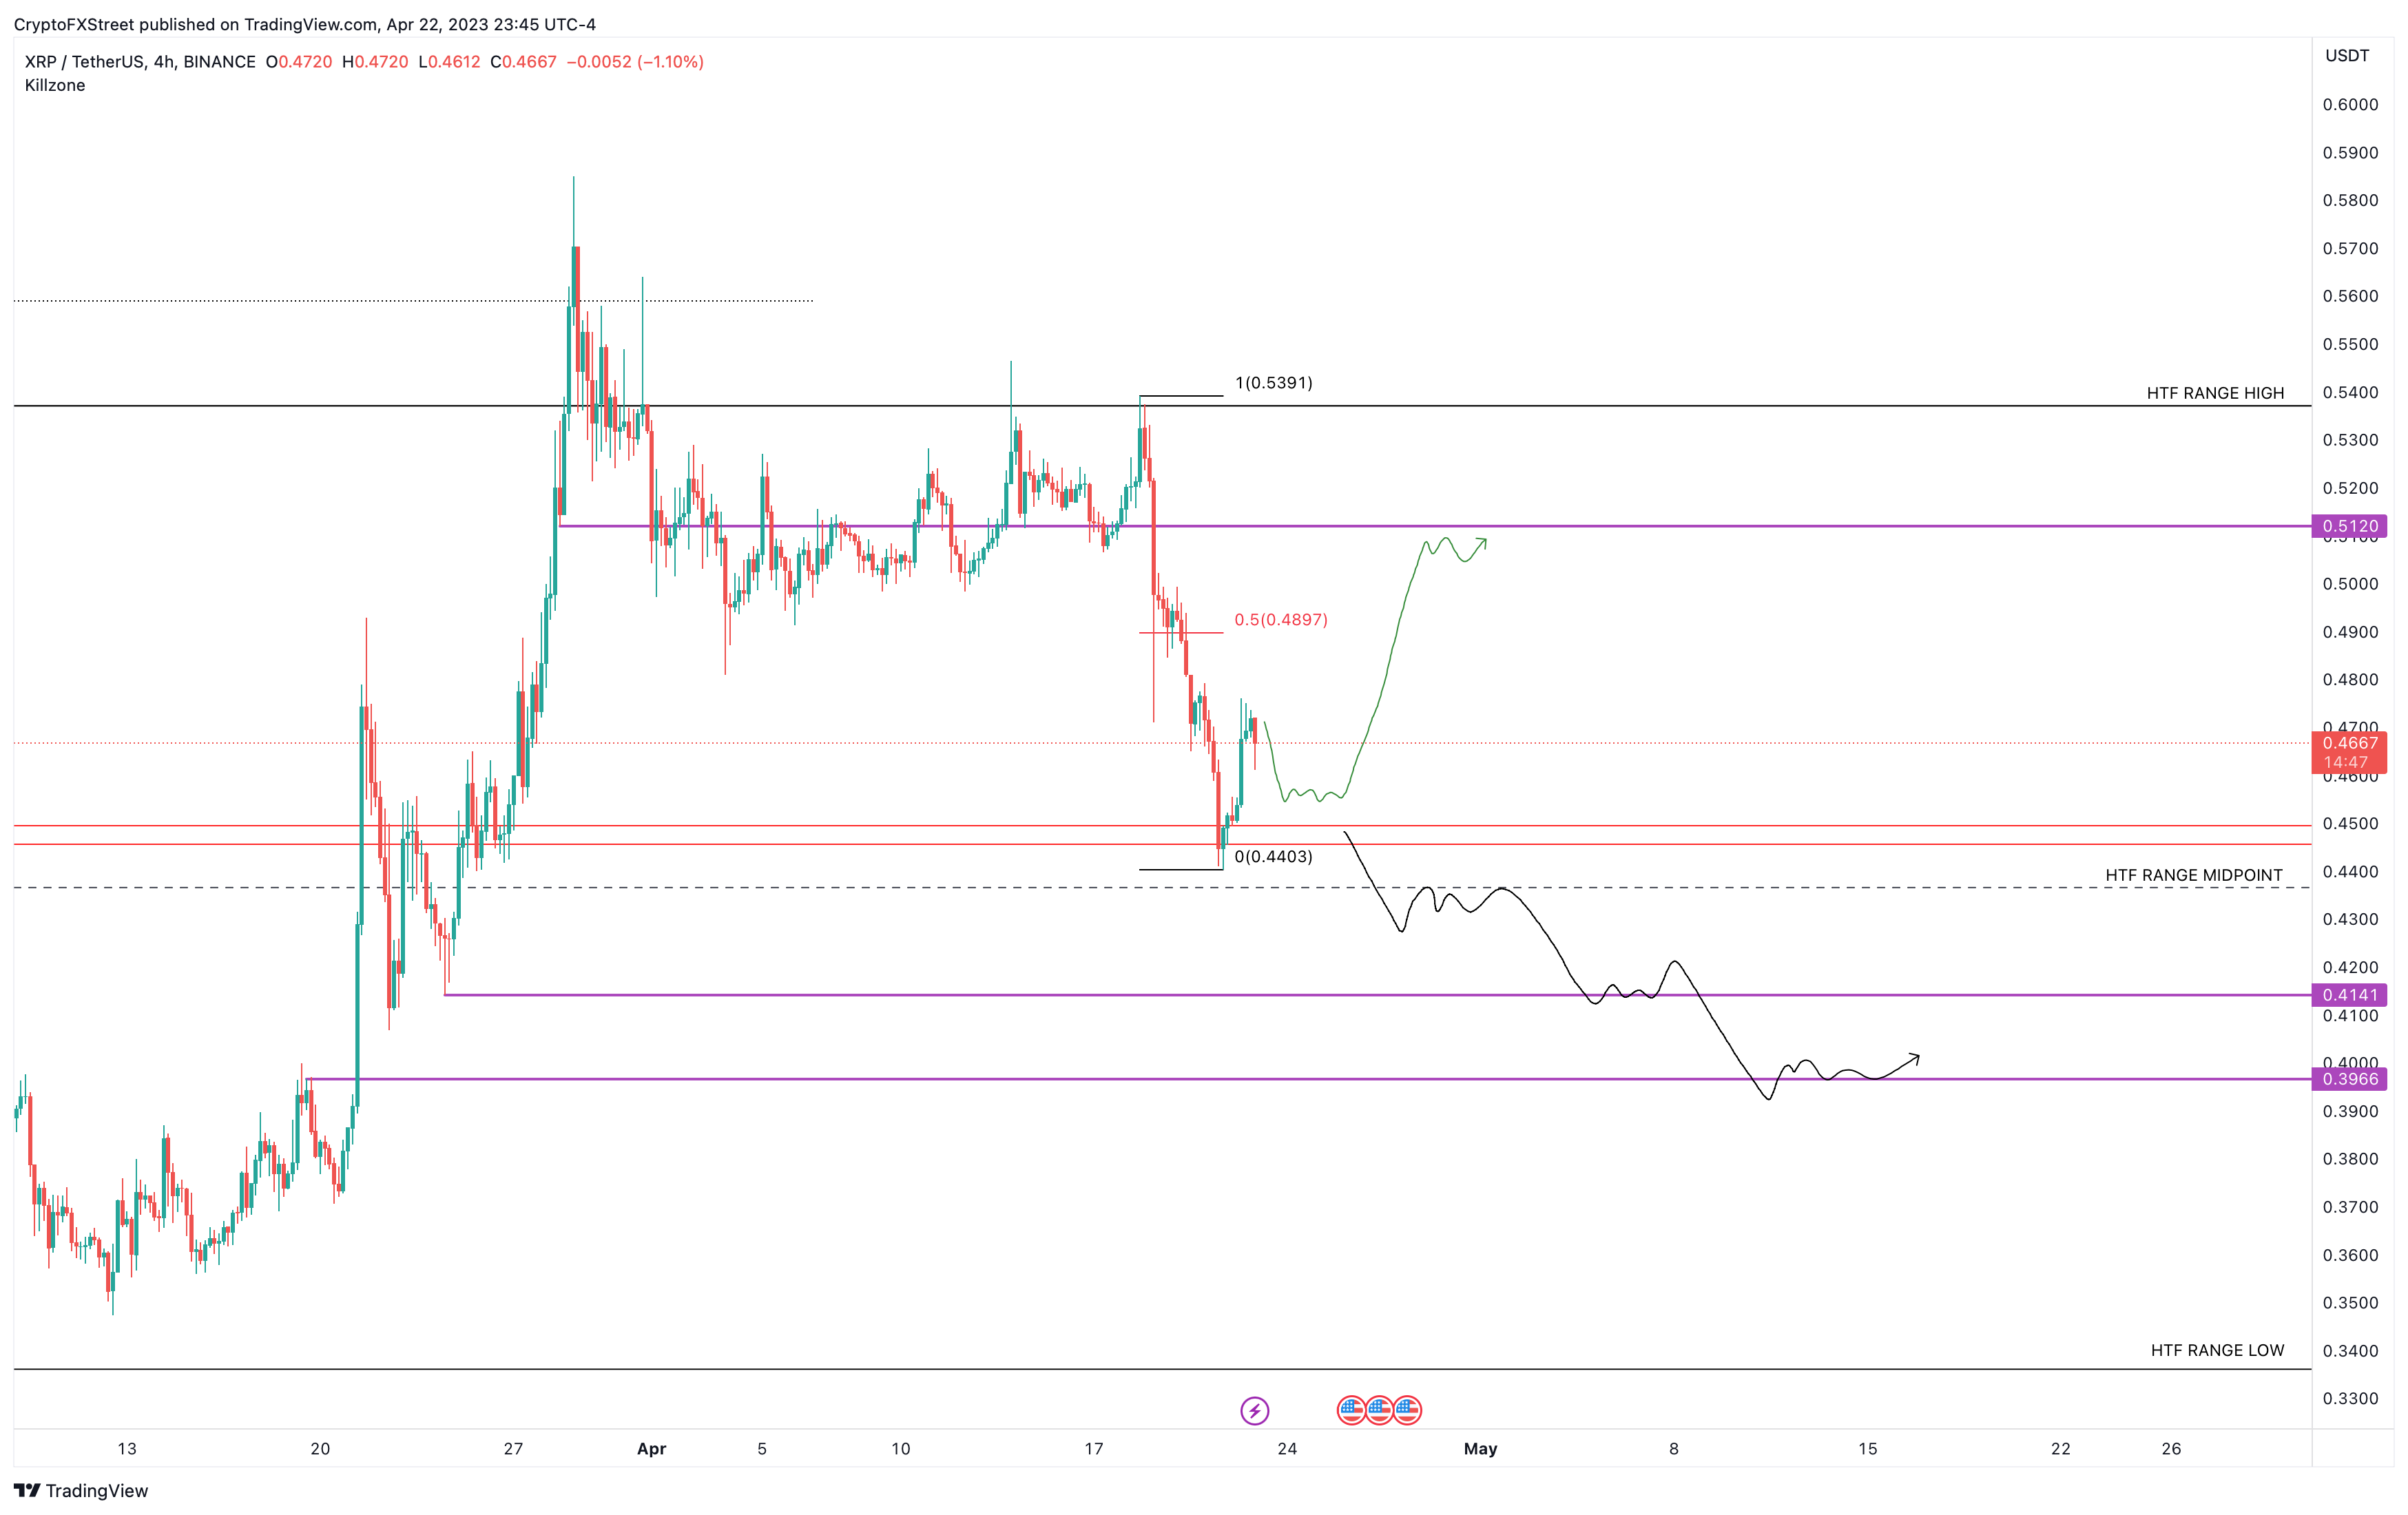
XRP/USDT 4-hour chart
The three-day chart shows that XRP price has been hovering inside the $0.537 to $0.336 range for nearly a year now. If the remittance token does breach this range to the upside, it would trigger a massive bullish response.
In such a case, XRP price could retest the $0.633 level, which is the midpoint of the 69% crash witnessed between March 26, 2022, and June 18, 2022. This move would constitute a 35% gain but an extension to the $0.704 hurdle would bring it to a 50% gain for holders.
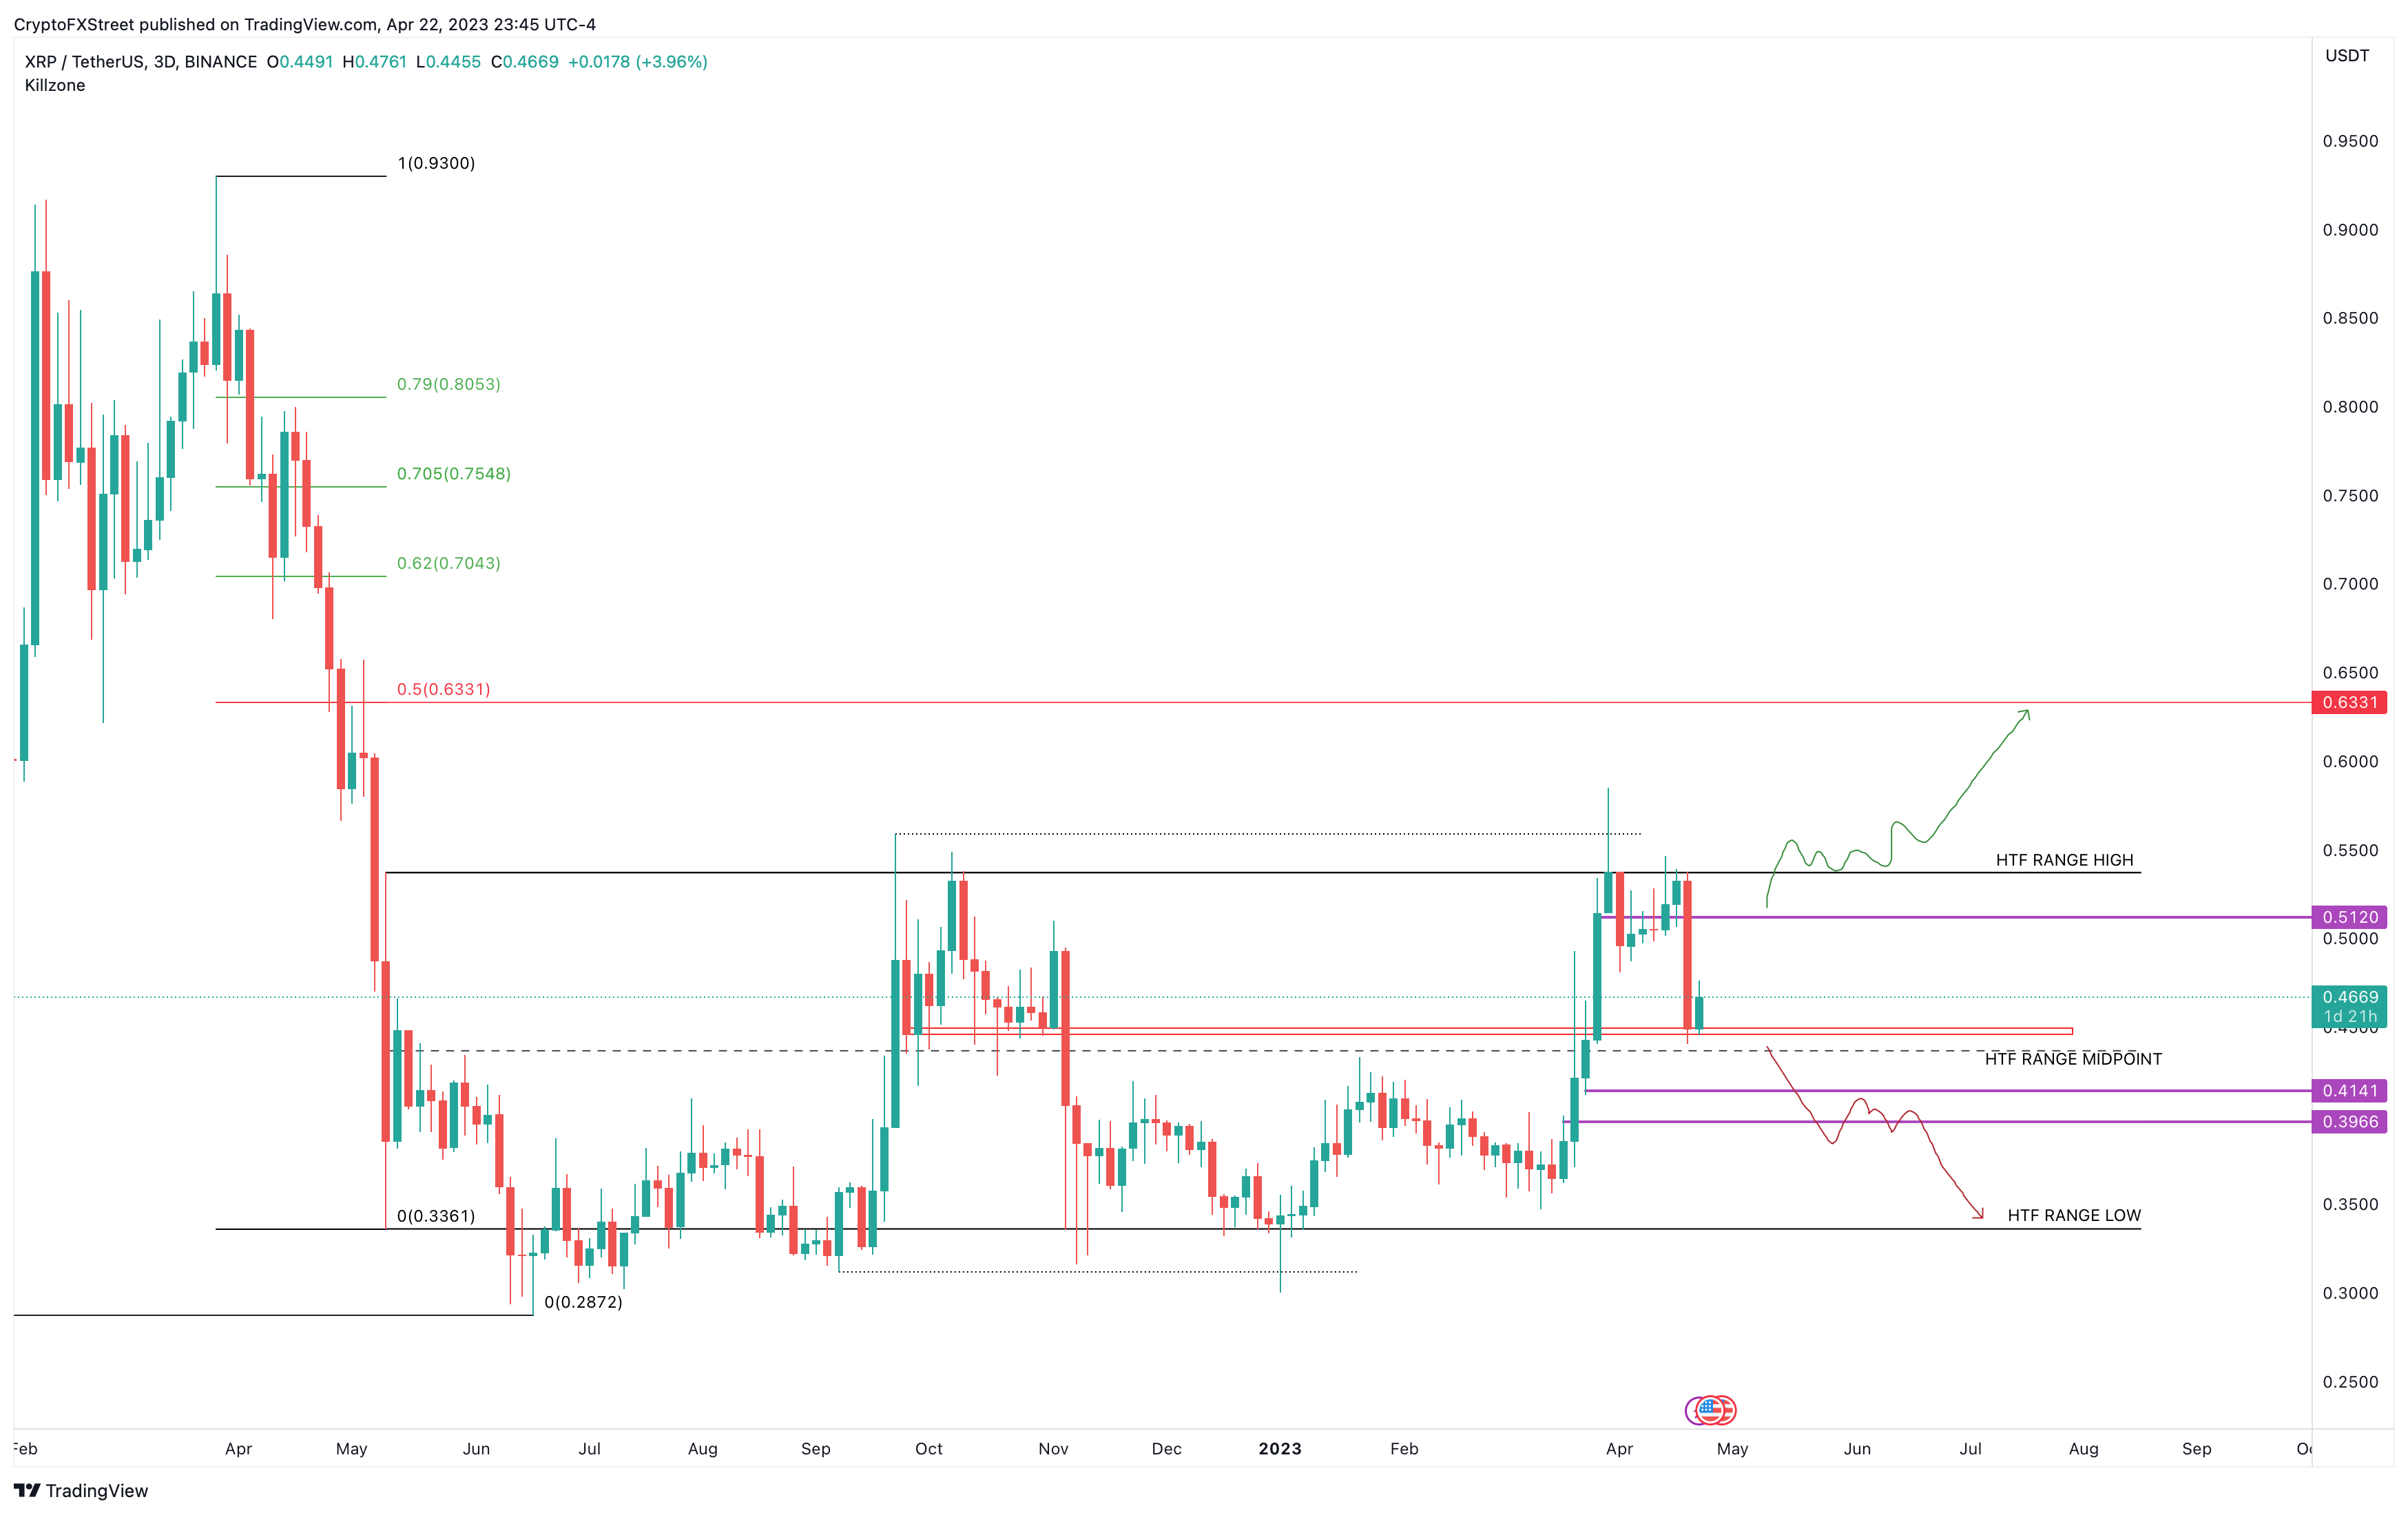
XRP/USDT 3-day chart
A breakdown of the range’s midpoint at $0.436 is the first telltale sign of weakness in buyers’ camp. However, if XRP price slices through the $0.414 and $0.396 levels, it would invalidate the bullish thesis and potentially trigger a crash to the range low at $0.336.
Author

Akash Girimath
FXStreet
Akash Girimath is a Mechanical Engineer interested in the chaos of the financial markets. Trying to make sense of this convoluted yet fascinating space, he switched his engineering job to become a crypto reporter and analyst.


