XRP Price Prediction: Ripple gears up for a 73% bull rally
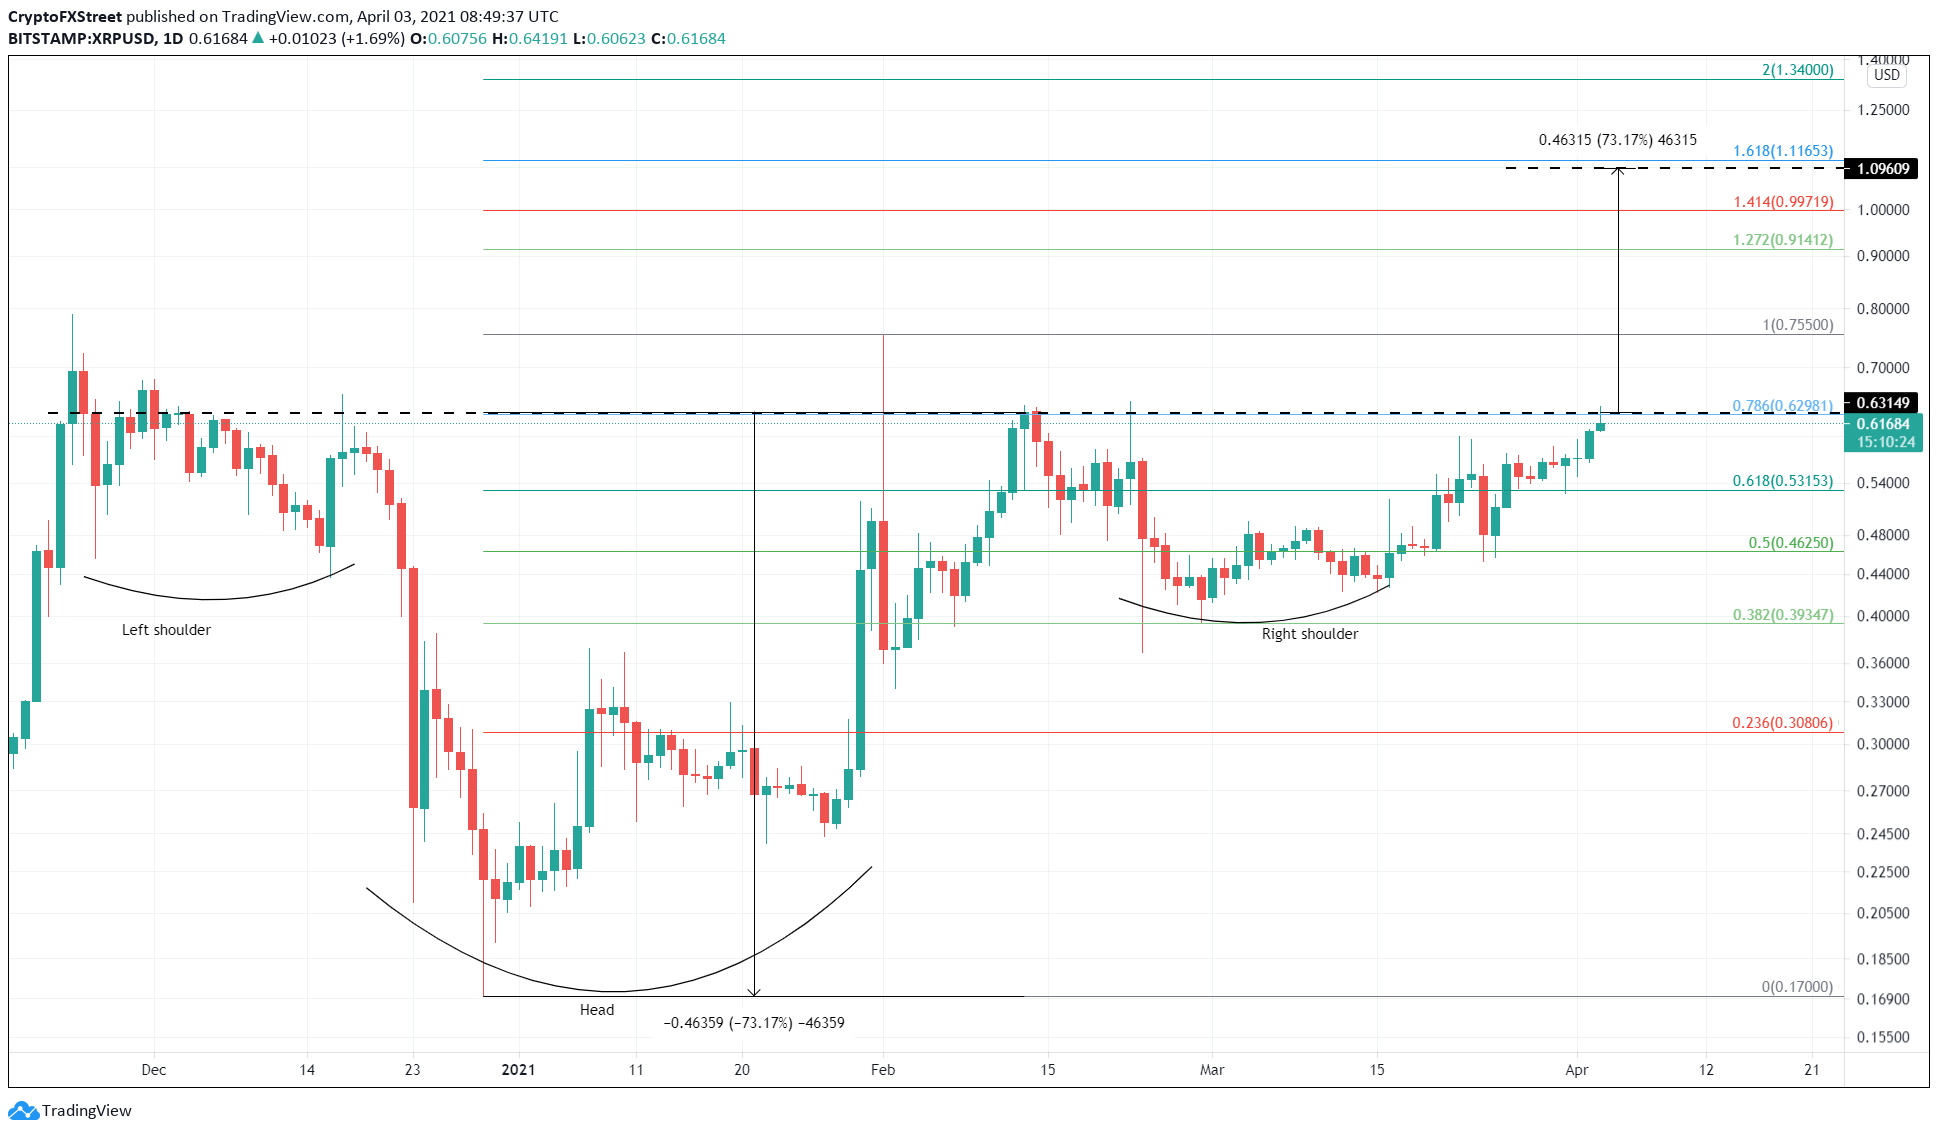
- The XRP price approaches the neckline of an inverse hand-and-shoulders pattern.
- A strong close above the neckline at $0.63 projects a 73% bull rally to $1.09.
- If sellers prevent this scenario from evolving, a reversal in Ripple’s bullish momentum could occur.

The XRP price is on the verge of flipping a resistance into support which could trigger a massive bull run.
XRP price eyes higher high
The XRP price action from late November 2018 to date has formed an inverse head-and-shoulders. This pattern is a bottom reversal pattern, and a successful breakout hints at the start of a new uptrend.
The technical formation contains three valleys, with the center one forming the head and the ones at the extremes are known as shoulders. While the shoulders are of comparable depths, the head extends far lower.
The peaks of these valleys are all connected at the neckline. In Ripple’s case, it is a horizontal resistance level at $0.63. This setup’s target at $1.09 is determined by measuring the head’s depth from the right shoulder and adding it to the breakout point at $0.63.
At the time of writing, the XRP price pierced through the horizontal supply barrier but hasn’t closed above it yet.
XRP/USDT 1-day chart
Supporting this bullish outlook are the addresses that have been on an accumulation spree since January. Whale addresses holding between 100,000 to 1,000,000 XRP and 1,000,000 to 10,000,000 XRP have increased by 6.17% and 5.85% in that order.
This move represents that investors are optimistic about the XRP price and believe that it will appreciate shortly.
%20[14.18.48,%2003%20Apr,%202021]-637530366687642193.png)
XRP whale holder distribution chart
Santiment’s MVRV model for Ripple price shows that it is hovering around 14%, suggesting that not many addresses are in profit. Therefore, these market participants might not be inclined to sell any time soon.
In early February, the 30-day MVRV model was hovering around the same level and was followed by a 45% surge in the XRP price.
%20[14.20.01,%2003%20Apr,%202021]-637530367130408776.png)
XRP MVRV 30-day chart
All in all, the XRP price looks primed for a bull run. However, this upward move is dependent on bulls’ potential to produce a decisive daily candlestick close above the neckline at $0.63. Failing to do so might result in a reversal of the bullish momentum.
In that case, the Ripple price could drop 16% toward the 61.8% Fibonacci retracement level at $0.53. If the sellers aren’t contained here, the pullback could extend toward the shoulder’s bottom at $0.46 or the 50% Fibonacci retracement level. A breach below this barrier will invalidate the inverse head-and-shoulders pattern and open the path for bears to rampage.
Author

Akash Girimath
FXStreet
Akash Girimath is a Mechanical Engineer interested in the chaos of the financial markets. Trying to make sense of this convoluted yet fascinating space, he switched his engineering job to become a crypto reporter and analyst.


