XRP Price Forecast: Ripple needs to clear the critical $0.60 level
- XRP price on pace to gain 30% in March, despite broader market weakness.
- Tranglo deal strengthens growing footprint in Southeast Asia.
- Ascending trendline continues to limit downside volatility.

XRP price chart is a colorful reminder of the perils associated with trading a cryptocurrency amid a legal stand-off with the Securities and Exchange Commission (SEC). Despite the incomparable headline volatility, technical traders need to be mindful that Ripple is on pace to close March with a 30% gain and is only a few percent away from the critically important $0.600 level.
XRP price may need a catalyst to overcome heavy resistance
A series of wicks in the price range between $0.600-$0.800 are standing in front of a new retracement high for the 2018-2020 bear market. It has been a brutal resistance level that may require a significant catalyst to finally drive Ripple above the top of the range.
As mentioned above, Ripple needs to puncture the $0.600 price level on a weekly close before traders can turn their sights on much higher prices. Next, the digital token needs to close above the $0.800 level on a weekly basis, which is slightly above November 2020 high at $0.780.
If traders are successful in breaking through, attention will shift to the 0.236 Fibonacci retracement level at $0.863, followed by the psychologically important $1.000 level, which would yield a gain of 66%.
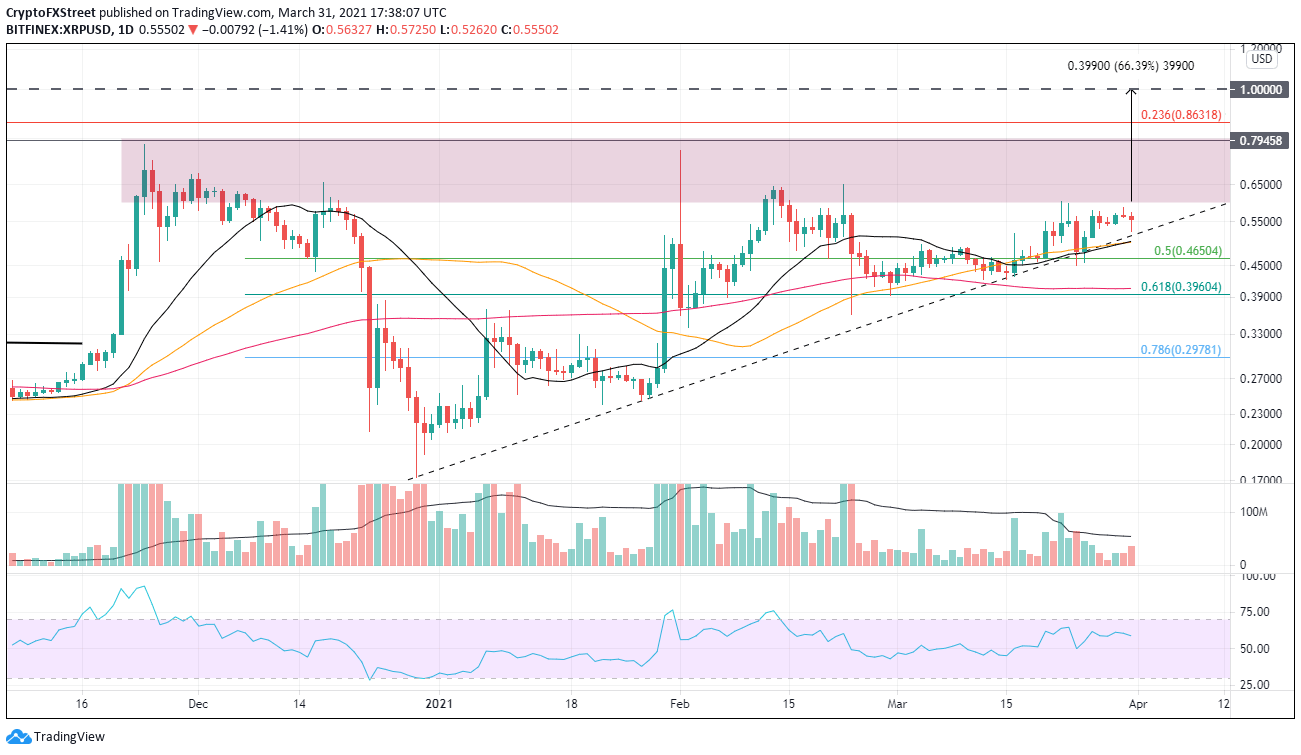
XRP/USD daily chart
A resumption of bearish legal news may target XRP price support at the union of the 21-day and 50-day SMAs at $0.500. Still, the legitimate support is at the 0.618 Fibonacci retracement level of the early 2021 advance at $0.396. Lower support levels include the February 23 low at $0.361 and the 0.786 retracement level at $0.298.
For now, traders are focusing on the bullish Ripple expansion outside of the United States, which should bode well for XRP price in the coming weeks.
Author

Sheldon McIntyre, CMT
Independent Analyst
Sheldon has 24 years of investment experience holding various positions in companies based in the United States and Chile. His core competencies include BRIC and G-10 equity markets, swing and position trading and technical analysis.



