|

Ripple Price Analysis: XRP/USD needs to crack this key resistance to conquer $0.65

  • XRP/USD in upside consolidates, gathering strength before the next push higher.
  • The No. 7 coin spots a bull crossover on the daily chart, amid a bullish RSI.
  • $0.65 remains on the buyers’ radar on a sustained break above critical resistance just above $0.60.

Ripple (XRP/USD) is holding the higher ground for the third straight session, as sellers continue to lurk just shy of the $0.60 mark.

The no.7 crypto coin awaits a strong catalyst for the next push higher. The Good Friday holiday-thinned trading could likely propel exaggerated move in the spot.

At the time of writing, XRP/USD is trading better bid above $57,100 levels, posting small gains on the day. The coin tracks the upbeat sentiment across the crypto board, as Bitcoin briefly regains the $60,000 threshold.

XRP/USD: Looking for a big break higher?
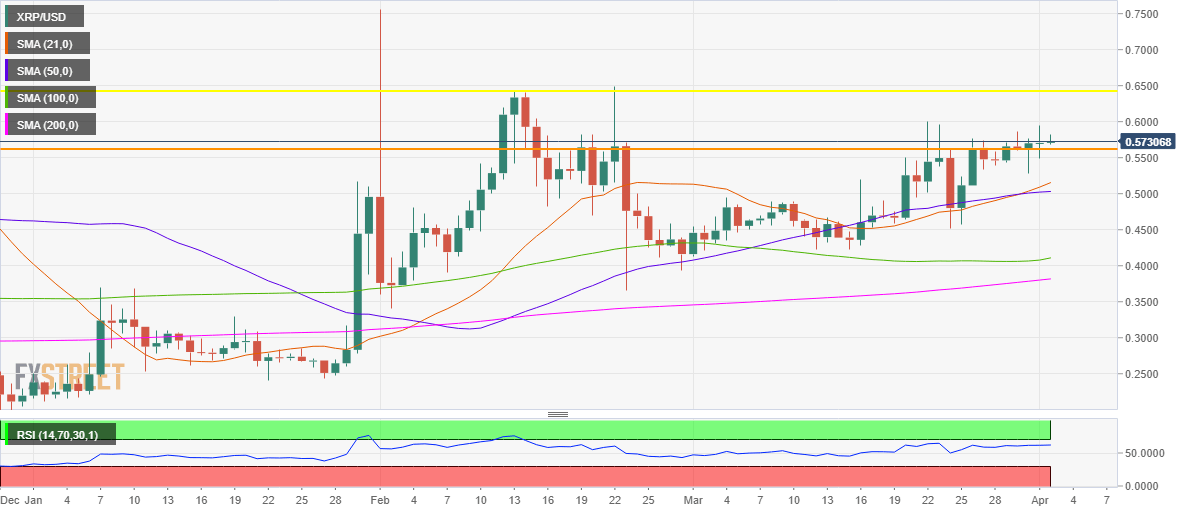
XRP/USD: Daily chart 

Ripple’s daily chart shows that the price has failed to find acceptance above the powerful horizontal trendline resistance (orange) at $0.60.

This has prompted the bulls to enter a phase of consolidation, as they gather strength once again, in order to yield a sustained break above the latter.

If the upside break materializes, the next fierce barrier awaits around $0.6425, which is a static resistance, represented by a horizontal trendline (yellow).

A daily closing above that level is needed to resume the uptrend towards $0.80.

The 14-day Relative Strength Index (RSI) trades listless but comfortable above the midline, suggesting that there remains an additional room for the spot to rise.

A bull crossover, charted by the 21-daily moving average (DMA) having pierced through the 50-DMA from below, further adds credence to the bullish potential.

On the flip side, Immediate support awaits at the bullish 21-DMA of $0.5155, below which the 50-DMA at $0.5031 could be challenged.

Further south, the strong psychological support at $0.50 could help limit the declines in the XRP/USD pair.

XRP/USD: Additional levels to consider

XRP/USD

Overview
Today last price0.57115
Today Daily Change-0.0011
Today Daily Change %-0.19
Today daily open0.5705
 
Trends
Daily SMA200.5127
Daily SMA500.5022
Daily SMA1000.4078
Daily SMA2000.3801
 
Levels
Previous Daily High0.5949
Previous Daily Low0.5485
Previous Weekly High0.6003
Previous Weekly Low0.4519
Previous Monthly High0.6003
Previous Monthly Low0.4131
Daily Fibonacci 38.2%0.5772
Daily Fibonacci 61.8%0.5663
Daily Pivot Point S10.5477
Daily Pivot Point S20.5249
Daily Pivot Point S30.5013
Daily Pivot Point R10.5941
Daily Pivot Point R20.6177
Daily Pivot Point R30.6405

Author

Dhwani Mehta

Dhwani Mehta

FXStreet

Residing in Mumbai (India), Dhwani is a Senior Analyst and Manager of the Asian session at FXStreet. She has over 10 years of experience in analyzing and covering the global financial markets, with specialization in Forex and commodities markets.

More from Dhwani Mehta
Share:

Editor's Picks

Bitcoin Weekly Forecast: BTC retreats as macro headwinds grow
Bitcoin (BTC) remains under pressure, down over 4% this week and trading around $76,900 at the time of writing on Friday. Institutional demand shows signs of weakness as spot BTC Exchange Traded Funds (ETFs) are on track to end their three-week inflow streak, recording nearly $500 million in net outflows through Thursday.
XRP falls toward key support as macro uncertainty, weak momentum cap recovery
Ripple (XRP) falls below $1.33 on Friday, marking the third consecutive day of declines. The token continues to track the broader cryptocurrency market downturn, with investors closely monitoring heightened macroeconomic uncertainty ahead of the United States (US) Consumer Price Index (CPI) release and next week’s Federal Reserve (Fed) monetary policy decision.
Crypto Today: Bitcoin, Ethereum, XRP stabilize at lower levels amid ETF outflows and macroeconomic risks
The broader cryptocurrency market is rising on Friday, with Bitcoin (BTC) trading above $77,000 after testing lower support near $76,500. Ethereum (ETH) shows signs of stability, hovering above the support provided at $2,400 despite capped upside at $2,500. Meanwhile, Ripple (XRP) holds above $1.33 after three straight days of declines, reflecting growing headwinds due to macroeconomic uncertainty.
Bitcoin pulls back as another golden cross fails to deliver
Earlier this week, Bitcoin formed a golden cross, a technical signal that occurs when the price’s 50-day moving average rises above the 200-day moving average and is conventionally viewed as a precursor to a bullish rally. Historically, however, that’s often not been the case.
Bitcoin: BTC retreats as macro headwinds grow
Bitcoin (BTC) remains under pressure, down over 4% this week and trading around $76,900 at the time of writing on Friday. Institutional demand shows signs of weakness as spot BTC Exchange Traded Funds (ETFs) are on track to end their three-week inflow streak, recording nearly $500 million in net outflows through Thursday.

