- XRP price has retraced to a crucial support barrier at $1.42.
- On-chain metrics like Network Profit and loss and MVRV suggest a reset due to recent crash.
- A bounce from the demand zone extending from $1.33 to $1.40 could trigger a 40% bull rally.
XRP price shows the promise of a bull rally that could create new yearly highs. This move comes after Ripple tested a critical support barrier.
XRP price looks to bounce
XRP price has dropped nearly 10% in a previous 4-hour candlestick to test the head-and-shoulders pattern’s neckline at $1.42.
This setup contains three swing lows, with the central dip referred to as the head, while the other two of comparable depths are known as shoulders. The swing highs of these peaks can be connected using trend lines to form a horizontal resistance at $1.42, known as a neckline.
A decisive close above $1.42 forecasts a 35% upswing, which is the distance between the neckline and head’s low. Adding this measure to the horizontal resistance yields a target at $1.98.
After breaking out of this pattern on April 30, the remittance token surged 19% but faced rejection around $1.65, which has resulted in a 15% crash to $1.42, where XRP price currently trades.
If the buyers join hand, XRP price could skyrocket 40% to $1.98 after slicing through the supply barrier at $1.65.
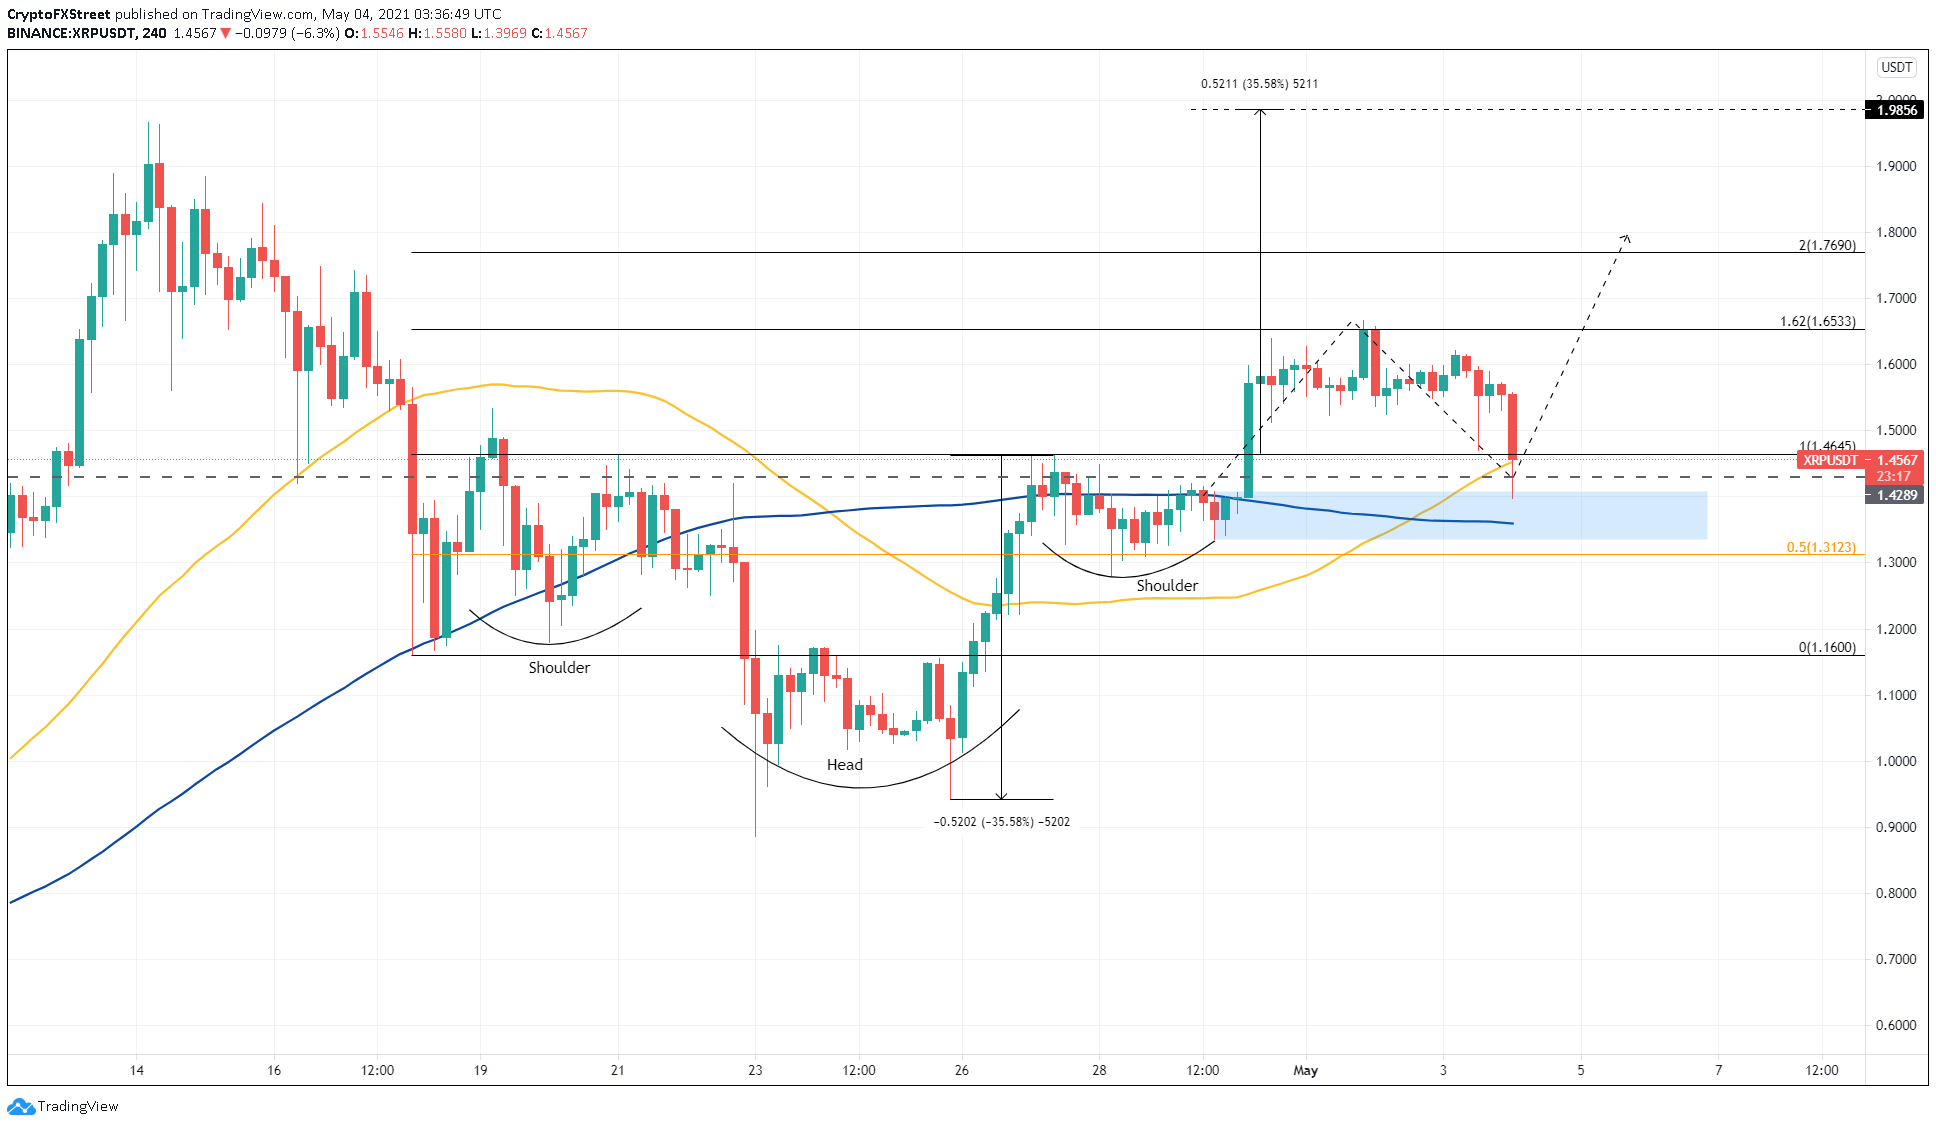
XRP/USDT 4-hour chart
Supporting this upswing is the reset of Ripple’s Network Profit and Loss (NPL) indicator, which calculates the overall return across all daily transactions. Hence, a spike in this metric coincides with the possibility of a local top.
This fundamental index surged on May 1, representing the initial rejection at $1.65. Following this, May 3 also saw a sudden uptick in NPL, suggesting that many addresses were in profit, opening up the possibility of investors booking profits.
At the time of writing, this metric has reset to zero, paving the way for more upswings.
XRP network profit and loss chart
The same events transpired with Santiment’s 30-day MVRV model, which tracks the network’s profit/loss for addresses that purchased XRP in the past month.
This metric is also resetting after hitting a local top at 0.238%, indicating that a bullish upswing could be around the corner.
XRP 30-day MVRV chart
Regardless of the pattern, if the bearish momentum slices through $1.31, then the optimistic scenario around XRP price will face invalidation. In that case, Ripple could slide 11% to test the subsequent support at $1.16.
Information on these pages contains forward-looking statements that involve risks and uncertainties. Markets and instruments profiled on this page are for informational purposes only and should not in any way come across as a recommendation to buy or sell in these assets. You should do your own thorough research before making any investment decisions. FXStreet does not in any way guarantee that this information is free from mistakes, errors, or material misstatements. It also does not guarantee that this information is of a timely nature. Investing in Open Markets involves a great deal of risk, including the loss of all or a portion of your investment, as well as emotional distress. All risks, losses and costs associated with investing, including total loss of principal, are your responsibility. The views and opinions expressed in this article are those of the authors and do not necessarily reflect the official policy or position of FXStreet nor its advertisers. The author will not be held responsible for information that is found at the end of links posted on this page.
If not otherwise explicitly mentioned in the body of the article, at the time of writing, the author has no position in any stock mentioned in this article and no business relationship with any company mentioned. The author has not received compensation for writing this article, other than from FXStreet.
FXStreet and the author do not provide personalized recommendations. The author makes no representations as to the accuracy, completeness, or suitability of this information. FXStreet and the author will not be liable for any errors, omissions or any losses, injuries or damages arising from this information and its display or use. Errors and omissions excepted.
The author and FXStreet are not registered investment advisors and nothing in this article is intended to be investment advice.
Recommended Content
Editors’ Picks

Top 3 Price Prediction Bitcoin, Ethereum, Ripple: BTC consolidates while ETH and XRP show some strength
Bitcoin (BTC) consolidated between $94,000 and $100,000 in the last nine days. Ethereum (ETH) and Ripple (XRP) prices stood relatively stronger and have gained nearly 3% and 7%, respectively, this week.

Trump's US reciprocal tariffs pause fails to improve Bitcoin and crypto market outlook
Bitcoin (BTC) and top cryptos halted their declines following a pause in President Donald Trump's reciprocal tariff plans, which were originally scheduled to go live on Thursday.

Ripple vs SEC battle nears end as the regulator acknowledges Grayscale XRP ETF filing
Ripple's XRP is up 4% in the early hours of Friday following the Securities and Exchange Commission (SEC) acknowledgment of Grayscale's 19b-4 filing to convert its XRP Trust to an ETF.

200,000 New Investors Buy Ripple (XRP) 30-Days After Gensler’s Farewell: What Next for Stellar (XLM)?
Ripple (XRP) price consolidated around $2.40 on Thursday, up 11% since Monday, technical indicators suggest Stellar (XLM) has joined the rally.

Bitcoin: BTC consolidates before a big move
Bitcoin's (BTC) price has been consolidating between $94,000 and $100,000 for the last ten days, and, when writing on Friday, it hovers around $97,000. Despite this consolidation, US Bitcoin spot Exchange Traded Funds (ETFs) data recorded a total net outflow of $650.80 million until Thursday, hinting signs of weakness among institutional investors.

The Best Brokers of the Year
SPONSORED Explore top-quality choices worldwide and locally. Compare key features like spreads, leverage, and platforms. Find the right broker for your needs, whether trading CFDs, Forex pairs like EUR/USD, or commodities like Gold.