XRP price spike from critical support hints at a 20% rally
- XRP price will trigger a bullish hammer candlestick pattern with a daily close above yesterday’s high.
- Ripple holds critical support during a new wave of cryptocurrency weakness.
- MVRV on-chain metric may be forming a bear flag on the 12-hour chart, signaling more weakness.

XRP price built a bullish hammer candlestick pattern yesterday as the cryptocurrency complex experienced a new wave of selling pressure. Today, Ripple is endeavoring to continue the rebound, but it needs a daily close above the hammer high to trigger a unique trading opportunity for investors.
XRP price projects tactical opportunities
The once prevailing optimistic XRP price outlook failed to materialize when the digital asset declined below the lower trend line of a bear flag pattern. The Ripple pattern’s measured moved target is $0.432, offering stubborn market operators an opportunity to lose 53% from the June 5 breakdown. The measured move target is calculated using the length of the flagpole. A drop of that magnitude leaves XRP price entrenched in the legal uncertainty price range that followed the November 2020 high into the December 2020 low.
However, yesterday, XRP price successfully defended the critical November 24, 2020, high at $0.780, constructing a bullish hammer candlestick pattern that may trigger today with a close above the high at $0.887. It was the third successful test of the $0.780 level since May 29, underlining the importance of the level in the broader outlook for Ripple.
If the hammer pattern triggers today, it should motivate XRP price to revisit the psychologically important $1.00, a level that has been equally instructive for the price action since May 24. A defeat of $1.00 will stimulate Ripple to challenge the flag’s lower trend line at $1.058, representing a 20% gain from the current price. XRP price could potentially test the declining 50-day simple moving average (SMA) at $1.219 before introducing a pullback.
An ambitious target is the confluence of the flag’s upper trend line at $1.306 with the 50% retracement of the April-May decline at $1.307.
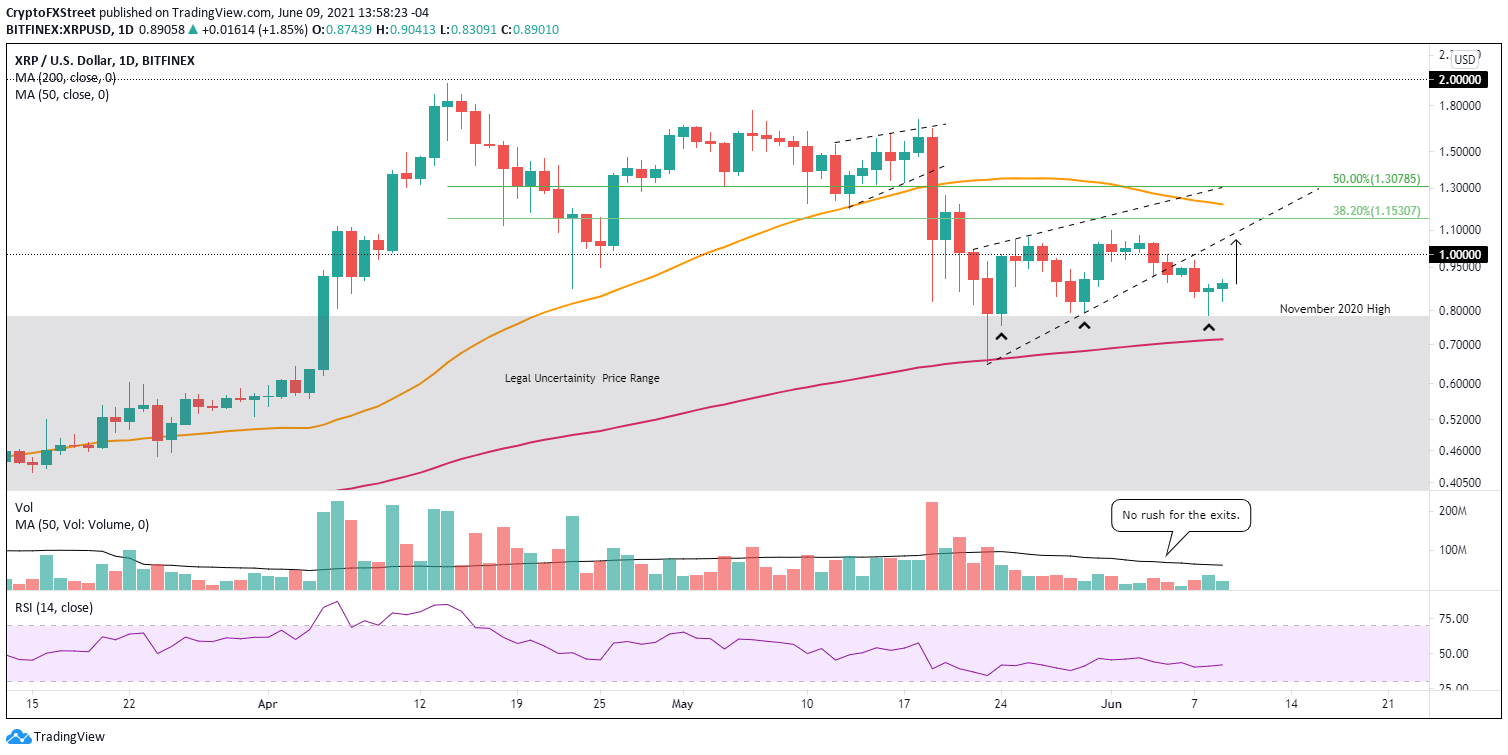
XRP/USD daily chart
Downside risk begins with a daily close below $0.780. The next XRP price support is the 200-day SMA at $0.661 and the May 23 low of $0.652. Any weakness beyond there imposes a difficult challenge for recovery any time soon.
A negative sign for the originating bounce is the bear flag forming on the Santiment XRP 365- day Market Value To Realized Value (MVRV) metric. The MVRV metric measures the average profit/loss of all coins that moved within the last 365 days, with negative values highlighting undervalued conditions and positive values showing overvalued conditions.
In the case of the 365-day MVRV, the bear flag could be a warning that Ripple remains overvalued and could face renewed selling pressure below the critical $0.780 level.
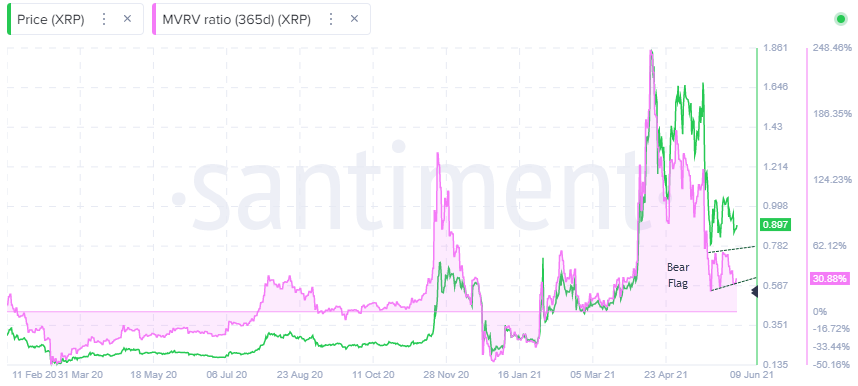
XRP MVRV ratio (365) - Santiment
XRP price is a crossroads, boxed in by the $0.780 support level and the range around the psychologically important $1.00. Until there is a meaningful close below or above those levels, Ripple is only positioned for tactical opportunities. Investors need to be precise with their entries around support and resistance in this environment and use daily closes to dictate longer-term capital allocation.
Author

Sheldon McIntyre, CMT
Independent Analyst
Sheldon has 24 years of investment experience holding various positions in companies based in the United States and Chile. His core competencies include BRIC and G-10 equity markets, swing and position trading and technical analysis.


