XRP Price Prediction: Ripple at a make-or-break point between bull flag pattern and several sell signals
- Ripple price battling at the bull flag upper trendline near $0.58.
- A 4-hour candlestick close below $0.50 could extend the pullback.
- However, a close above the supply barrier at $0.56 would suggest a 35% price rally.

XRP price has seen a 90% bull rally since February 2. Following this upswing, Ripple began consolidating, resulting in a bull flag pattern.
XRP price at crossroads
XRP price is forming higher highs and higher lows on the 4-hour chart. Joining these pivot points using a trendline results in a “flag,” and the 90% upswing that precedes this is known as the “flag pole.”
A four-hour candlestick close above $0.56 would represent the continuation pattern’s end and signal a 35% upswing to $0.75. This target is measured by adding the length of the flag pole to the breakout point.
Since XRP's rejection at $0.58 on February 20, it has been on a downswing and is, at the time of writing, testing the support level at $0.50. If the remittances token manages to slice through this demand barrier, then a 10% drop to $0.45 seems likely.
Adding credence to this bearish outlook are the SuperTrend and the Parabolic SAR indicator, both of which have flashed sell signals on February 15 and 20, respectively.
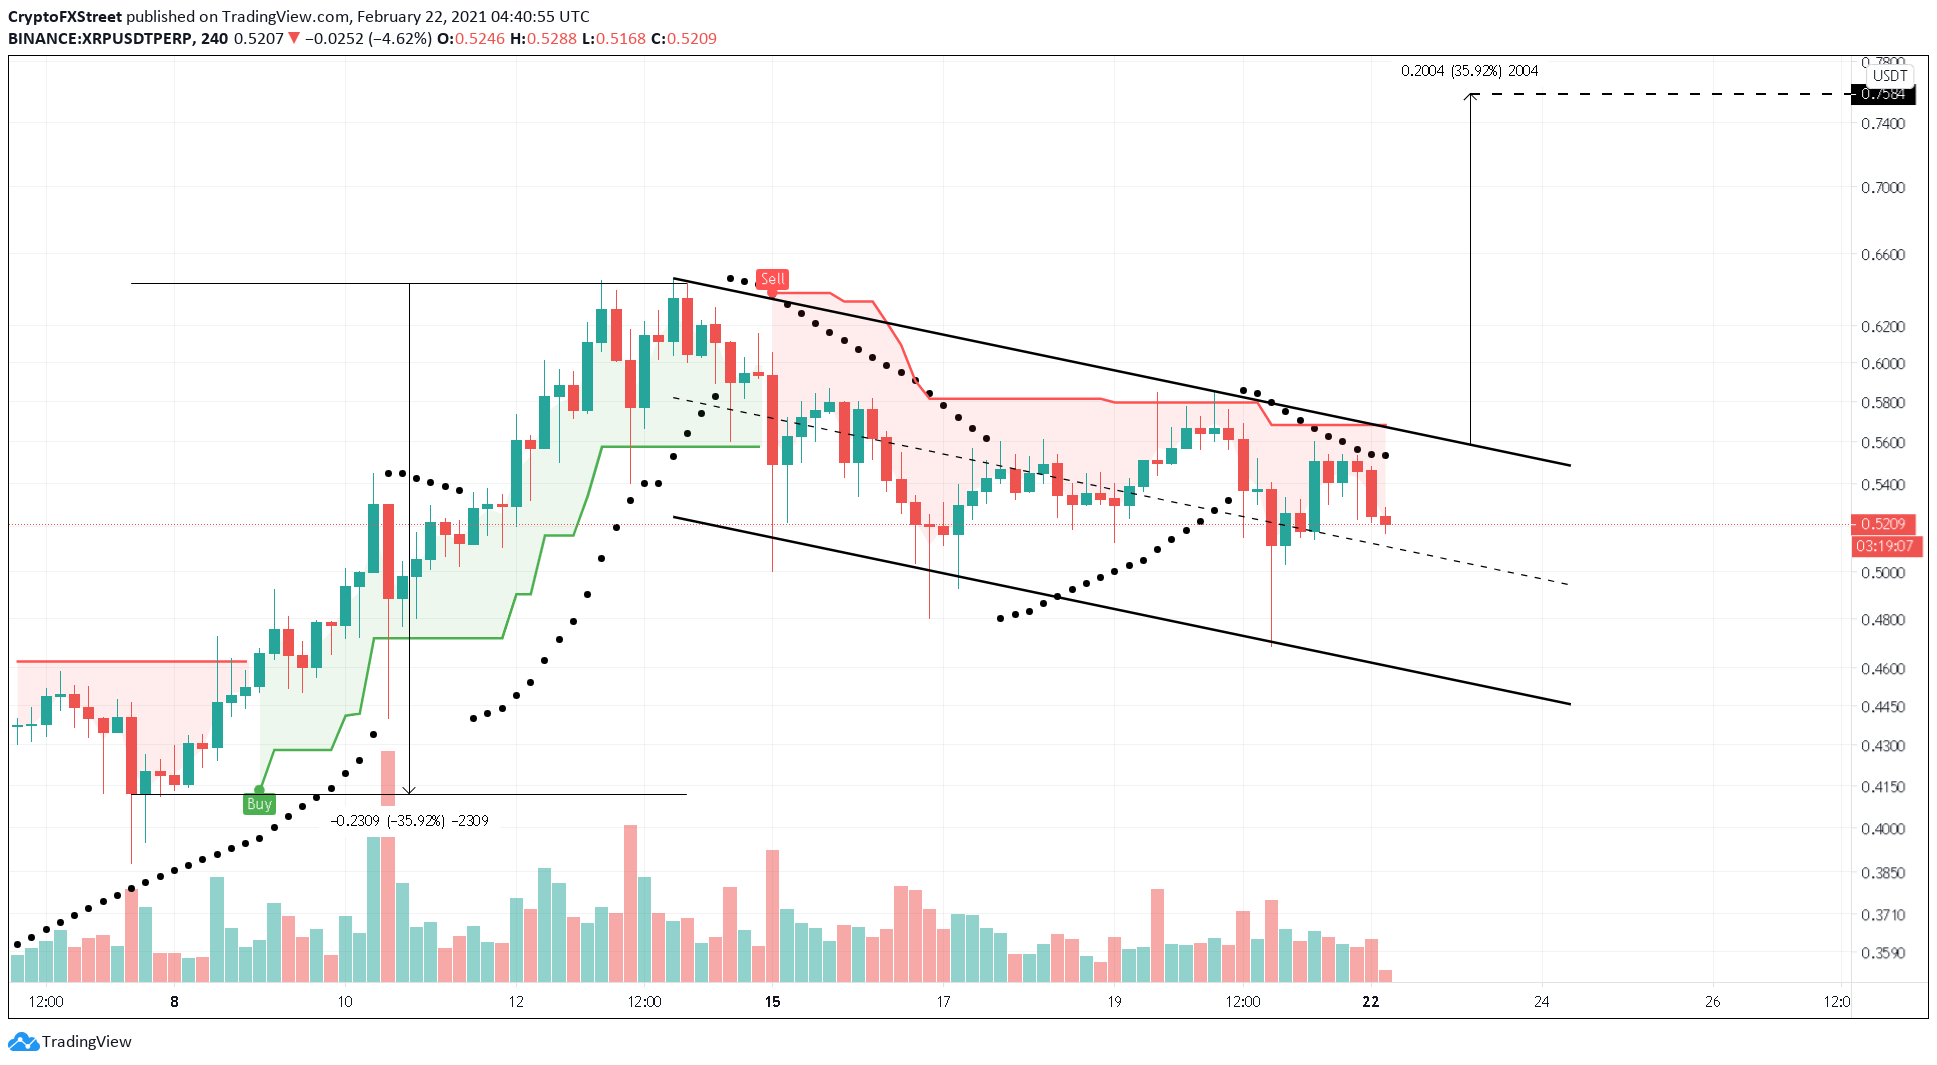
XRP/USDT 4-hour chart
However, investors need to be aware that a bounce from the channel’s upper trendline is possible. Therefore, a spike in buying pressure leading to a close above the bull flag’s upper trendline at $0.56 could signal a breakout.
In this case, XRP price could rise as high as $0.75.
Author

Akash Girimath
FXStreet
Akash Girimath is a Mechanical Engineer interested in the chaos of the financial markets. Trying to make sense of this convoluted yet fascinating space, he switched his engineering job to become a crypto reporter and analyst.


