XRP price could plummet 7% as whales dump their Ripple holdings
- XRP got legal clarity from Judge Torres’ ruling in the SEC vs. Ripple lawsuit, but since the news the altcoin has wiped out all gains.
- XRP whales holding between 100,000 and 1,000,000 XRP tokens have shed their holdings over the past two months.
- Ripple XRP price is tethered to 200-day EMA at $0.5251, the altcoin faces the possibility of a 7% decline.
XRP price dropped and wiped out all its gains from Judge Torres' ruling that offered Ripple a partial victory in the lawsuit brought forward by the Securities and Exchange Commission (SEC). XRP is one of the only altcoins in the crypto ecosystem, after Bitcoin and Ethereum, to receive legal clarity in a lawsuit ruling.
Whales have consistently shed their holdings of the token over the past two months, adding to the selling pressure on the asset.
Also read: XRP price risks decline to $0.41, amidst developments in SEC vs. Ripple lawsuit
Ripple XRP price wipes out all gains despite legal clarity
In the SEC vs. Ripple lawsuit, Judge Torres declared a partial win for the payment firm and considered XRP a “non-security.” Following Judge Torres’ ruling, Judge Failla in the recent Uniswap lawsuit referred to Bitcoin and Ethereum as commodities and not “securities”.
The legal clarity on the status of these digital assets has fueled bullish sentiment among the crypto community of holders and acted as a bullish catalyst for asset prices. However, in the case of XRP, the price gains were wiped out soon enough with developments in the lawsuit and other macroeconomic developments in the economy.
XRP price resumed its downward trend, and the asset is currently tethered to its 200-day Exponential Moving Average (EMA) at $0.5251.
XRP price decline supported by on-chain metric
Whale accumulation is considered a typical bullish indicator. Similarly, when whales shed their holdings of an asset, it foreshadows an upcoming correction in the asset. XRP whales holding between 100,000 and 1,000,000 XRP tokens have consistently reduced their token holdings and redistributed them, adding to the selling pressure on the asset.
This chart from on-chain intelligence tracker Santiment shows the state of whale holdings over the past two months.
 [10.38.47, 31 Aug, 2023]-638290584830498263.png)
Whales holding between 100,000 and 1,000,000 XRP tokens vs price
XRP price risks 7% decline
Lockridge Okoth, a technical analyst at FXStreet, analyzed the XRP price chart and noted that the altcoin needs to break its tether to the 200-day EMA at $0.5251 to make the next move. Since August 18, XRP price has been in a state of consolidation, and there is a probability of dipping into the demand zone between $0.5040 and $0.4600. A decisive daily candlestick close below the mean threshold at $0.4800 strengthens the downward trend of the asset, and XRP risks a drop to $0.4191.
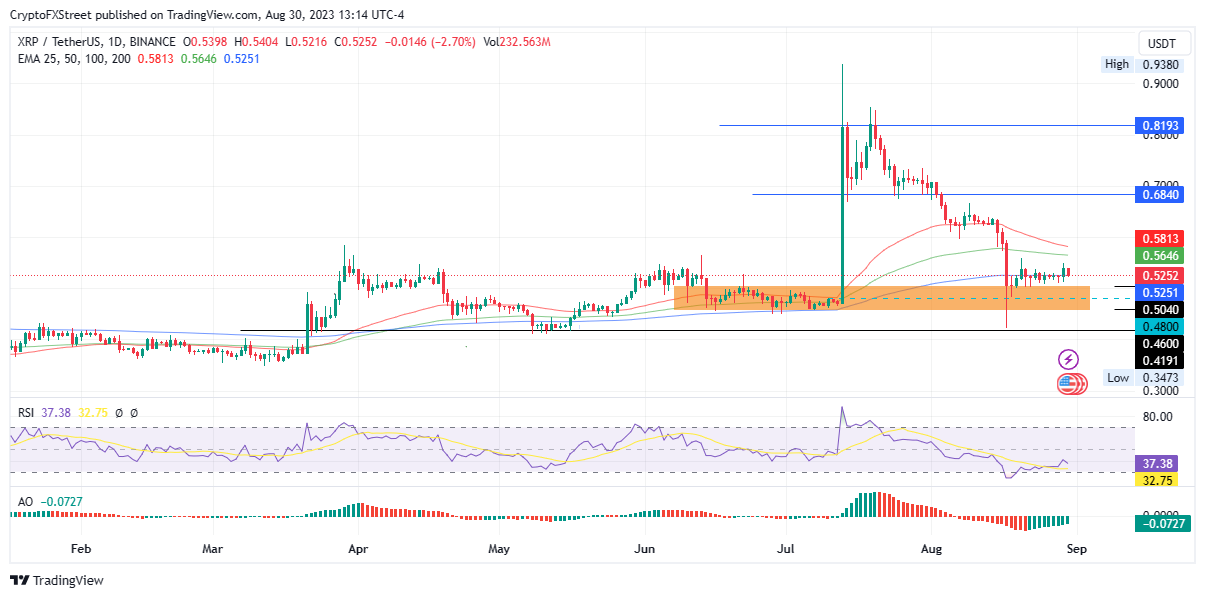
XRP/USDT one-day price chart on Binance
If XRP price breaches the 50 and 100-day EMAs at $0.5813 and $0.5646, a sustained uptrend to the $0.6840 level is likely.
Cryptocurrency metrics FAQs
What is circulating supply?
The developer or creator of each cryptocurrency decides on the total number of tokens that can be minted or issued. Only a certain number of these assets can be minted by mining, staking or other mechanisms. This is defined by the algorithm of the underlying blockchain technology. Since its inception, a total of 19,445,656 BTCs have been mined, which is the circulating supply of Bitcoin. On the other hand, circulating supply can also be decreased via actions such as burning tokens, or mistakenly sending assets to addresses of other incompatible blockchains.
What is market capitalization?
Market capitalization is the result of multiplying the circulating supply of a certain asset by the asset’s current market value. For Bitcoin, the market capitalization at the beginning of August 2023 is above $570 billion, which is the result of the more than 19 million BTC in circulation multiplied by the Bitcoin price around $29,600.
What is trading volume?
Trading volume refers to the total number of tokens for a specific asset that has been transacted or exchanged between buyers and sellers within set trading hours, for example, 24 hours. It is used to gauge market sentiment, this metric combines all volumes on centralized exchanges and decentralized exchanges. Increasing trading volume often denotes the demand for a certain asset as more people are buying and selling the cryptocurrency.
What is funding rate?
Funding rates are a concept designed to encourage traders to take positions and ensure perpetual contract prices match spot markets. It defines a mechanism by exchanges to ensure that future prices and index prices periodic payments regularly converge. When the funding rate is positive, the price of the perpetual contract is higher than the mark price. This means traders who are bullish and have opened long positions pay traders who are in short positions. On the other hand, a negative funding rate means perpetual prices are below the mark price, and hence traders with short positions pay traders who have opened long positions.
Like this article? Help us with some feedback by answering this survey:
Author

Ekta Mourya
FXStreet
Ekta Mourya has extensive experience in fundamental and on-chain analysis, particularly focused on impact of macroeconomics and central bank policies on cryptocurrencies.


