XRP price fears 30% correction as Ripple shows minimal strength
- XRP price appears to be trading within a descending triangle, recording lower highs and struggling to make higher lows.
- The outlook for Ripple is bearish, as trading volume has steadily decreased while buyers are nowhere to be found.
- Now, the immediate support level at $0.79 coincides with the 2020 high would be the asset’s first line of defense before a free fall of 30% could be realized.

XRP price has continued to print lower highs following the top signal recorded on May 18. Ripple price action has lacked conviction and is met with indecision as the asset appears to be trading within a bearish pattern.
XRP price at risk of a steep decline
XRP price action has lagged behind and has seen minimal recovery since its swing low at $0.65 on May 23. Now, Ripple appears to be forming a descending triangle pattern on the 12-hour chart, as the cross-border remittance coin has created a descending trend line that connects its highs, and a horizontal trend line connecting its lows.
The chart pattern has come to fruition since May 29, and the prevailing direction of XRP price is sideways, and with minimal strength, Ripple appears to be headed lower to retest the horizontal support level indicated by the base of the triangle.
The target of the pattern is calculated by measuring the widest distance of the pattern and subtracting it from the horizontal trend line.
As long as XRP remains below the candle’s high, the outlook is pointed primarily bearish, targeting a 28% decline from the immediate support level at $0.79. It is essential for investors to note that the downside target falls within the demand zone that stretches from $0.54 to $0.65, adding credence to the bearish forecast.
However, the measured move would only be expected if Ripple falls below the aforementioned essential line of defense, which acts as meaningful support as it coincides with the 2020 high.
As XRP trading volume has continued to decline, Ripple may continue to trade within the descending triangle if there is no overpowering distribution between buyers and sellers.
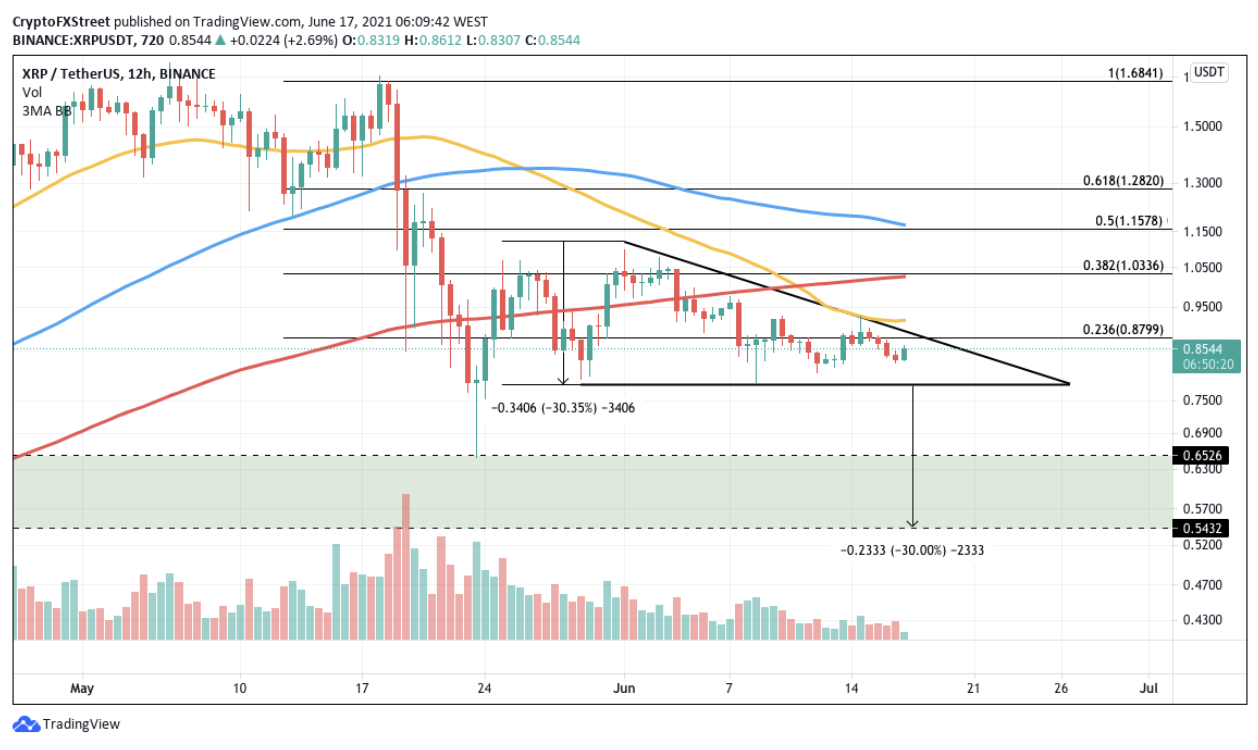
XRP/USDt 12-hour chart
To invalidate the bearish outlook, XRP price needs to rally above the topside trend line and the 23.6% Fibonacci extension level. Buyers will need to lift prices higher against the sellers, and the trading volume should contract and spike upon the resolution of the bearish pattern.
Should XRP be able to hold and trade above the 50 twelve-hour simple moving average at $0.91, Ripple could target a 12% rally to the next level of resistance, indicated by the 38.2% Fibonacci extension level coinciding with the 100 twelve-hour simple moving average at $1.03 before gaining more strength.
Author

Sarah Tran
Independent Analyst
Sarah has closely followed the growth of blockchain technology and its adoption since 2016.


