- XRP price created a double top formation, leading to an 8% downswing.
- This downtrend is likely to continue until it hits $0.821, the 62% Fibonacci retracement level.
- A bounce from this barrier promises an 18% bull rally to $0.961.
XRP price formed the second peak on June 14, indicating the formation of a double top. As a result, Ripple is starting to decline, heading toward an immediate support level.
While the current move from the remittance token might appear to be bearish, it is a minor retracement expected to morph into a rally.
XRP price at inflection point
XRP price rallied 18% to $0.93 after tagging the 70.5% Fibonacci retracement level at $0.783 on June 8. Although this run-up was undone quickly, a similar leg-up created the equal top at $0.93 on June 14 and is experiencing a downswing.
The immediate support level at $0.831 or the 62% Fibonacci retracement level at $0.821 will likely cushion this downswing. At this point, a resurgence of buying pressure might kick-start a bull rally that pushes XRP price up by 18% to the resistance barrier at $0.969.
If the buyers have their backs into this uptrend, Ripple might venture higher and tag the range high at $1.103. This move would be a 33% advance from $0.821.
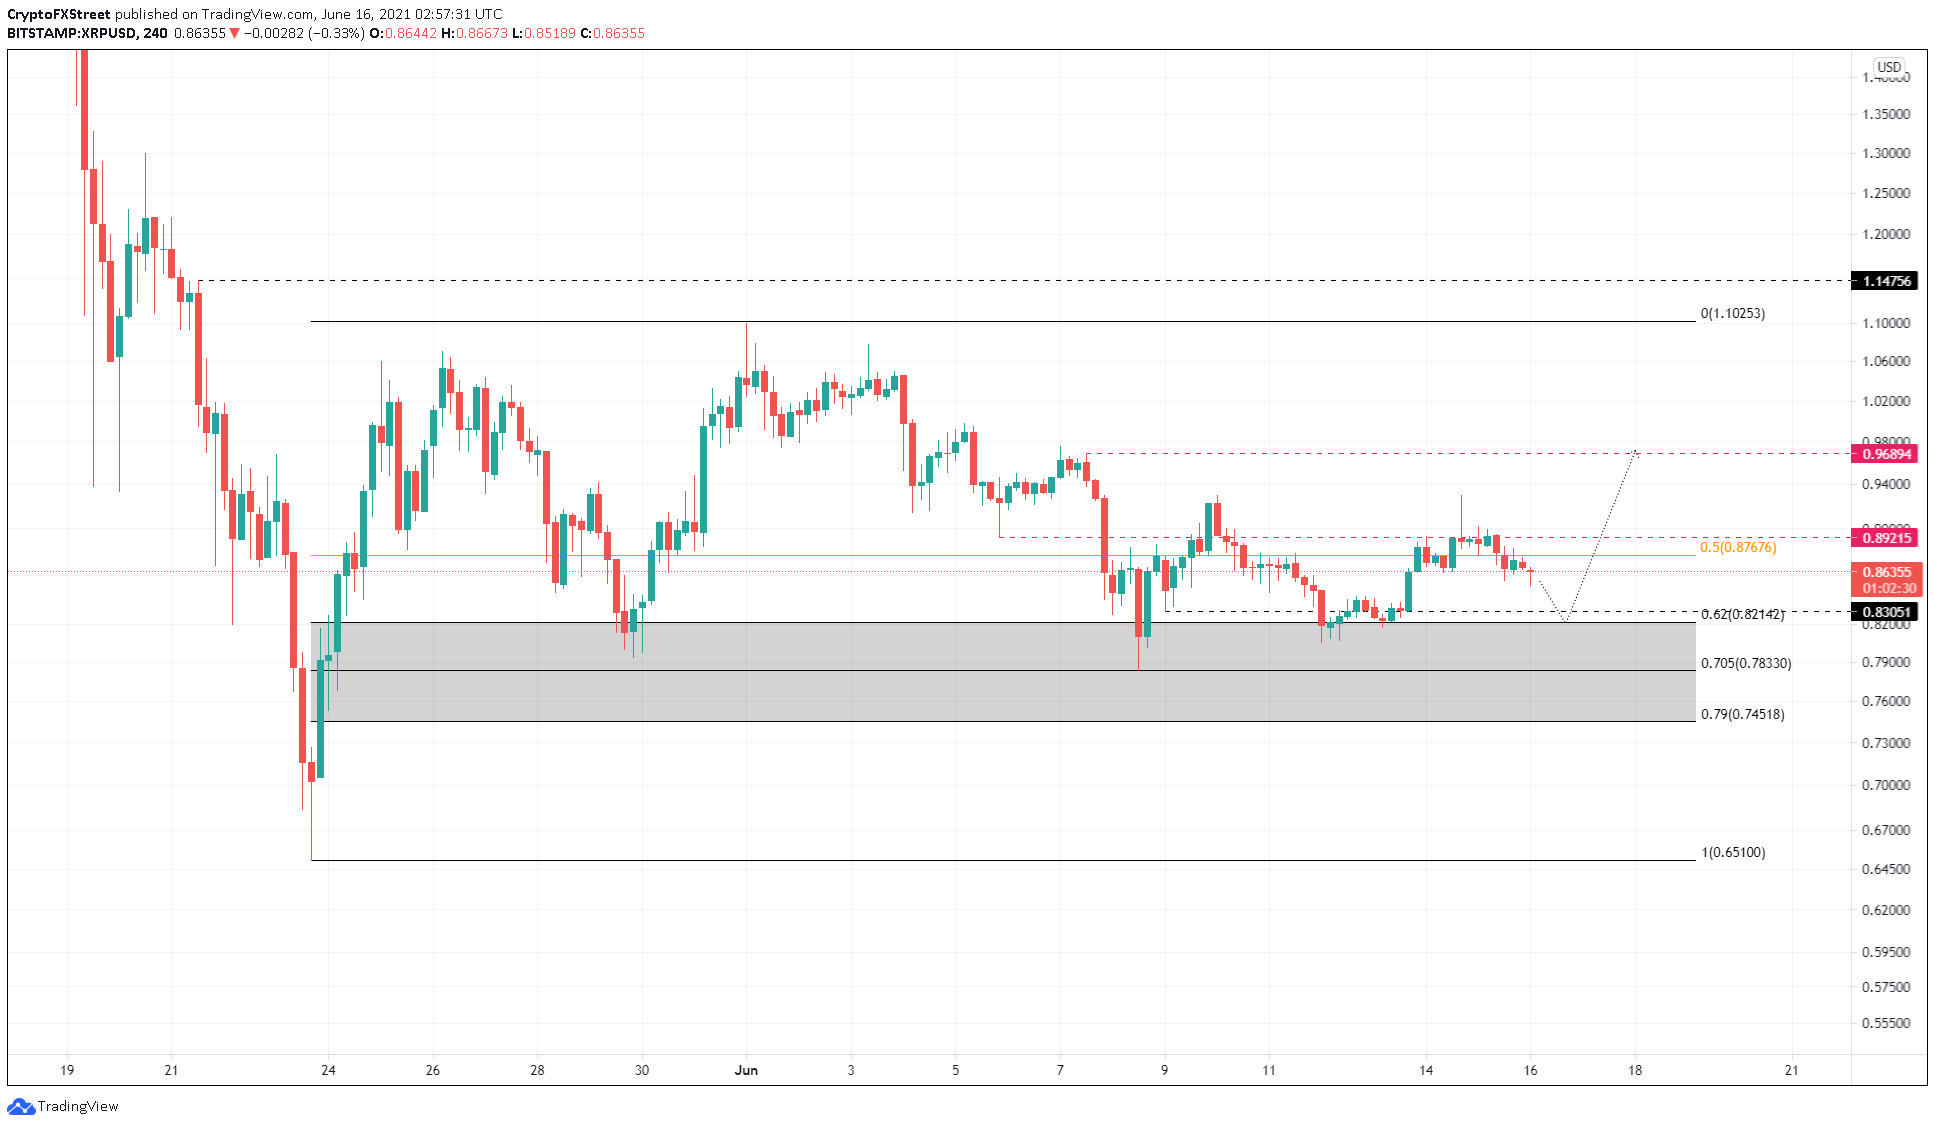
XRP/USDT 4-hour chart
Supporting this ascent is the 30-day Market Value to Realized Value (MVRV) model, currently hovering in the opportunity zone at -10.4%. This fundamental index is used to measure the average profit/loss of investors that bought XRP in the past month.
A negative value indicates that the short-term market participants are selling, creating an opportunity for the long-term holders to accumulate.
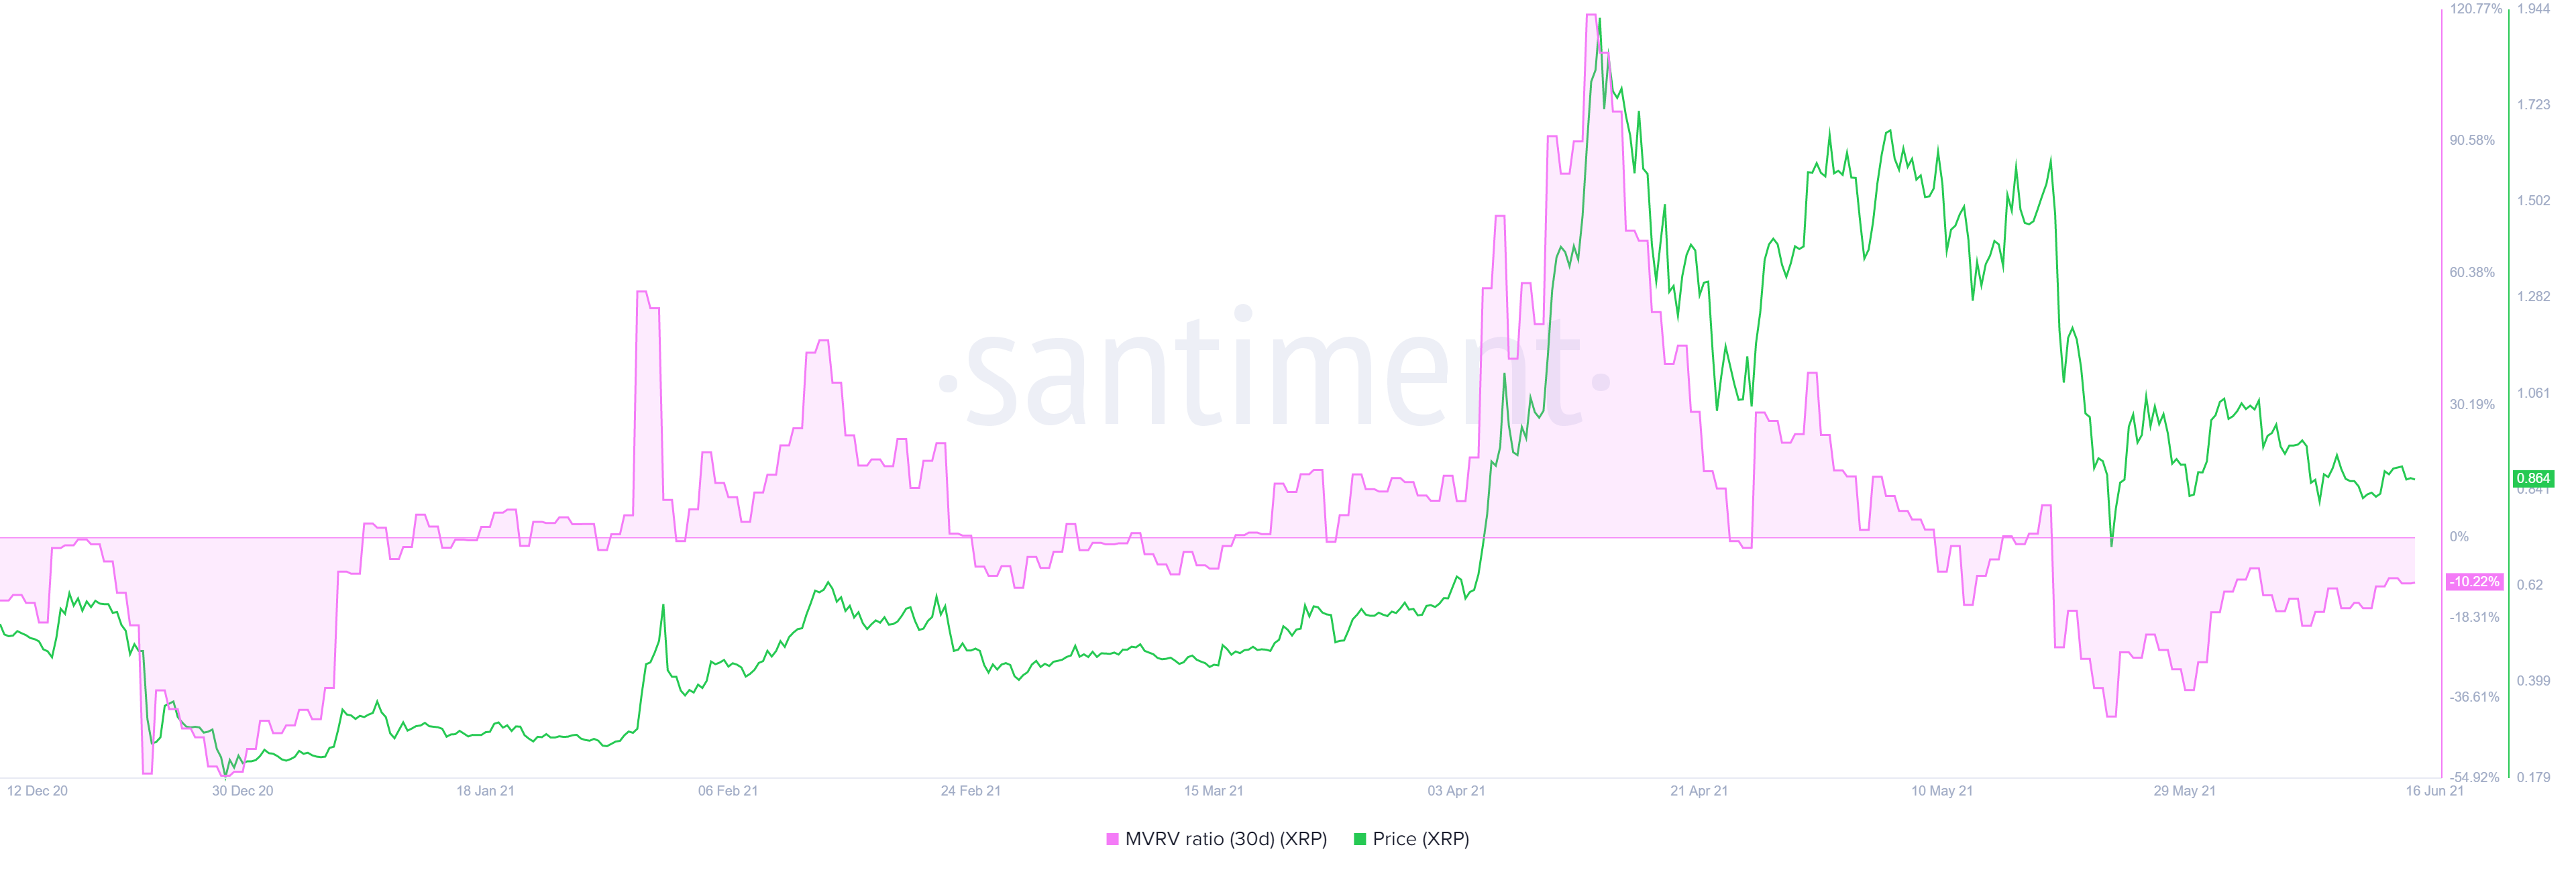
XRP 30-day MVRV chart
Further clarifying that there is no risk of a sell-off is the whale transaction count metric, which tracks transfers worth $100,000 or more. Often a spike in this on-chain model coincides with the local tops, indicating whales offloading their holdings.
Since the large transaction count for XRP price dropped from 803 on June 2 to 242 on June 15, a sudden spike in selling pressure seems unlikely.
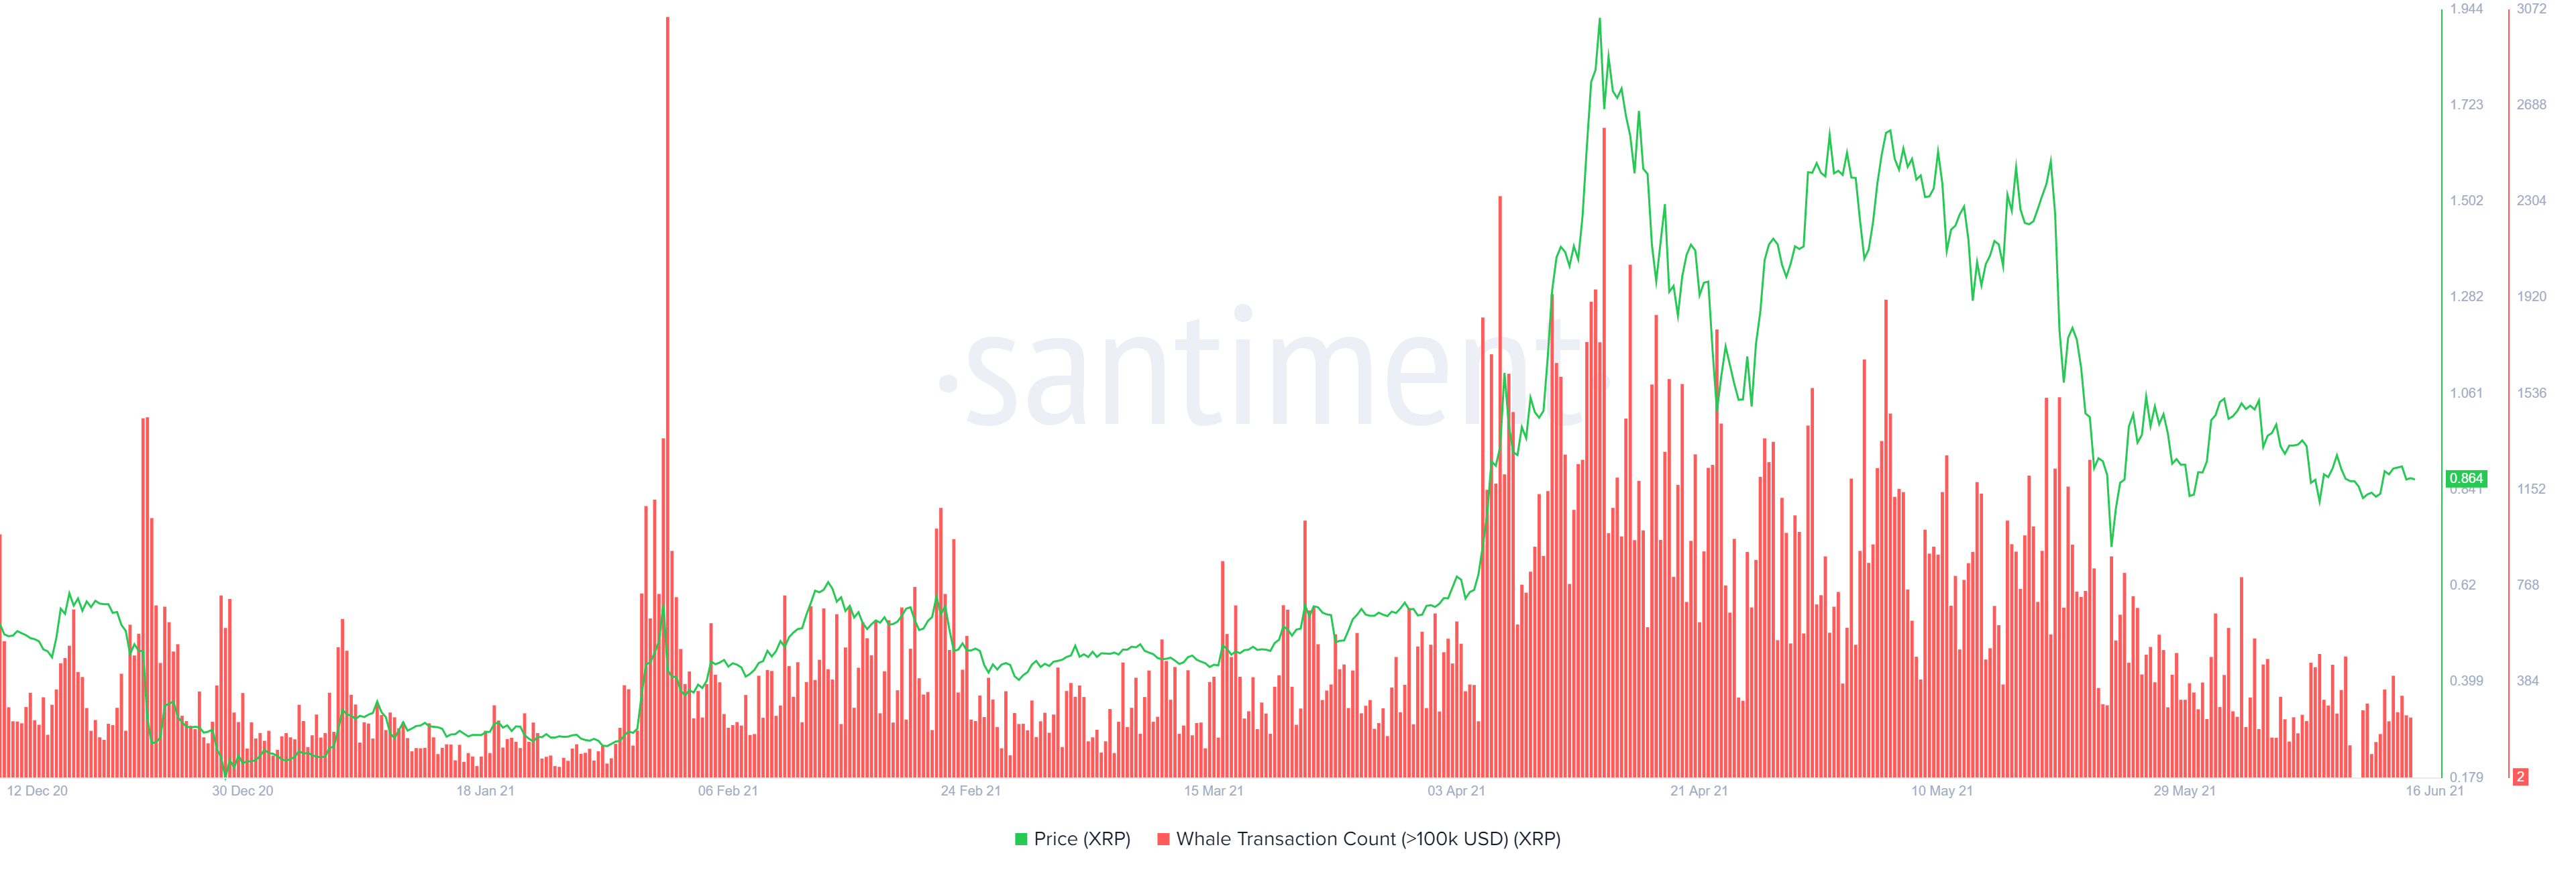
XRP whale transaction count chart
From a technical and an on-chain perspective, XRP price remains bullish in the mid-term. However, a decisive 4-hour candlestick close below the 79% Fibonacci retracement level at $0.745 will invalidate the bullish thesis explained above.
In such a case, investors can expect Ripple to venture to the range low at $0.651.
Information on these pages contains forward-looking statements that involve risks and uncertainties. Markets and instruments profiled on this page are for informational purposes only and should not in any way come across as a recommendation to buy or sell in these assets. You should do your own thorough research before making any investment decisions. FXStreet does not in any way guarantee that this information is free from mistakes, errors, or material misstatements. It also does not guarantee that this information is of a timely nature. Investing in Open Markets involves a great deal of risk, including the loss of all or a portion of your investment, as well as emotional distress. All risks, losses and costs associated with investing, including total loss of principal, are your responsibility. The views and opinions expressed in this article are those of the authors and do not necessarily reflect the official policy or position of FXStreet nor its advertisers. The author will not be held responsible for information that is found at the end of links posted on this page.
If not otherwise explicitly mentioned in the body of the article, at the time of writing, the author has no position in any stock mentioned in this article and no business relationship with any company mentioned. The author has not received compensation for writing this article, other than from FXStreet.
FXStreet and the author do not provide personalized recommendations. The author makes no representations as to the accuracy, completeness, or suitability of this information. FXStreet and the author will not be liable for any errors, omissions or any losses, injuries or damages arising from this information and its display or use. Errors and omissions excepted.
The author and FXStreet are not registered investment advisors and nothing in this article is intended to be investment advice.
Recommended Content
Editors’ Picks

Top 3 Price Prediction Bitcoin, Ethereum, Ripple: BTC consolidates while ETH and XRP show some strength
Bitcoin (BTC) consolidated between $94,000 and $100,000 in the last nine days. Ethereum (ETH) and Ripple (XRP) prices stood relatively stronger and have gained nearly 3% and 7%, respectively, this week.

Trump's US reciprocal tariffs pause fails to improve Bitcoin and crypto market outlook
Bitcoin (BTC) and top cryptos halted their declines following a pause in President Donald Trump's reciprocal tariff plans, which were originally scheduled to go live on Thursday.

Ripple vs SEC battle nears end as the regulator acknowledges Grayscale XRP ETF filing
Ripple's XRP is up 4% in the early hours of Friday following the Securities and Exchange Commission (SEC) acknowledgment of Grayscale's 19b-4 filing to convert its XRP Trust to an ETF.

200,000 New Investors Buy Ripple (XRP) 30-Days After Gensler’s Farewell: What Next for Stellar (XLM)?
Ripple (XRP) price consolidated around $2.40 on Thursday, up 11% since Monday, technical indicators suggest Stellar (XLM) has joined the rally.

Bitcoin: BTC consolidates before a big move
Bitcoin's (BTC) price has been consolidating between $94,000 and $100,000 for the last ten days, and, when writing on Friday, it hovers around $97,000. Despite this consolidation, US Bitcoin spot Exchange Traded Funds (ETFs) data recorded a total net outflow of $650.80 million until Thursday, hinting signs of weakness among institutional investors.

The Best Brokers of the Year
SPONSORED Explore top-quality choices worldwide and locally. Compare key features like spreads, leverage, and platforms. Find the right broker for your needs, whether trading CFDs, Forex pairs like EUR/USD, or commodities like Gold.