Top 3 Price Prediction Bitcoin, Ethereum, Ripple: BTC tags key resistance, while ETH and XRP envision a 20% drop
- Bitcoin price jumped 33% before reversing near the explicit resistance from $41,581-$44,023.
- Ethereum price nears the lower trend line of a multi-week symmetrical triangle continuation pattern.
- XRP price cannot generate price traction in the lows of the trading range, exposing it to further weakness.

Bitcoin price has been the champion of the cryptocurrency market since the June 8 low, energized by the El Salvador legal tender news and the bullish, spontaneous Elon Musk tweet on June 13. In contrast, Ethereum and Ripple have failed to engineer any recognizable bounce, putting their current consolidations at risk of a bearish resolution.
Bitcoin price intimidated on first rally attempt at towering resistance
Bitcoin price manufactured one of the better rallies in June, lifting the bellwether cryptocurrency 33% through the upper trend line of a symmetrical triangle pattern and above the psychologically important $40,000 for the first time since May 27. However, the volume has been above average for only one day, June 9.
The rally may be near exhaustion as Bitcoin price reverses from the formidable resistance drawn by several price levels, including the 50-day simple moving average (SMA) at $44,022, the 38.2% Fibonacci retracement of the April-May correction at $43,331 and the 200-day SMA at $42,712. It should be noted that the upcoming death cross will reinforce the resistance range in the next couple of days.
A pullback to the upper trend line of the symmetrical triangle around $37,091 is a higher probability outcome for Bitcoin price in the short term. Still, it should be anticipated that BTC will strike several attempts at displacing the notable resistance.
Today, only a daily close above the 50-day SMA at $44,022 would alter the neutral outlook for Bitcoin price. If it occurs, BTC investors can begin to entertain a rally to the all-time high of $64,899, and of course, a continuation to the much-hyped target of $100,000.
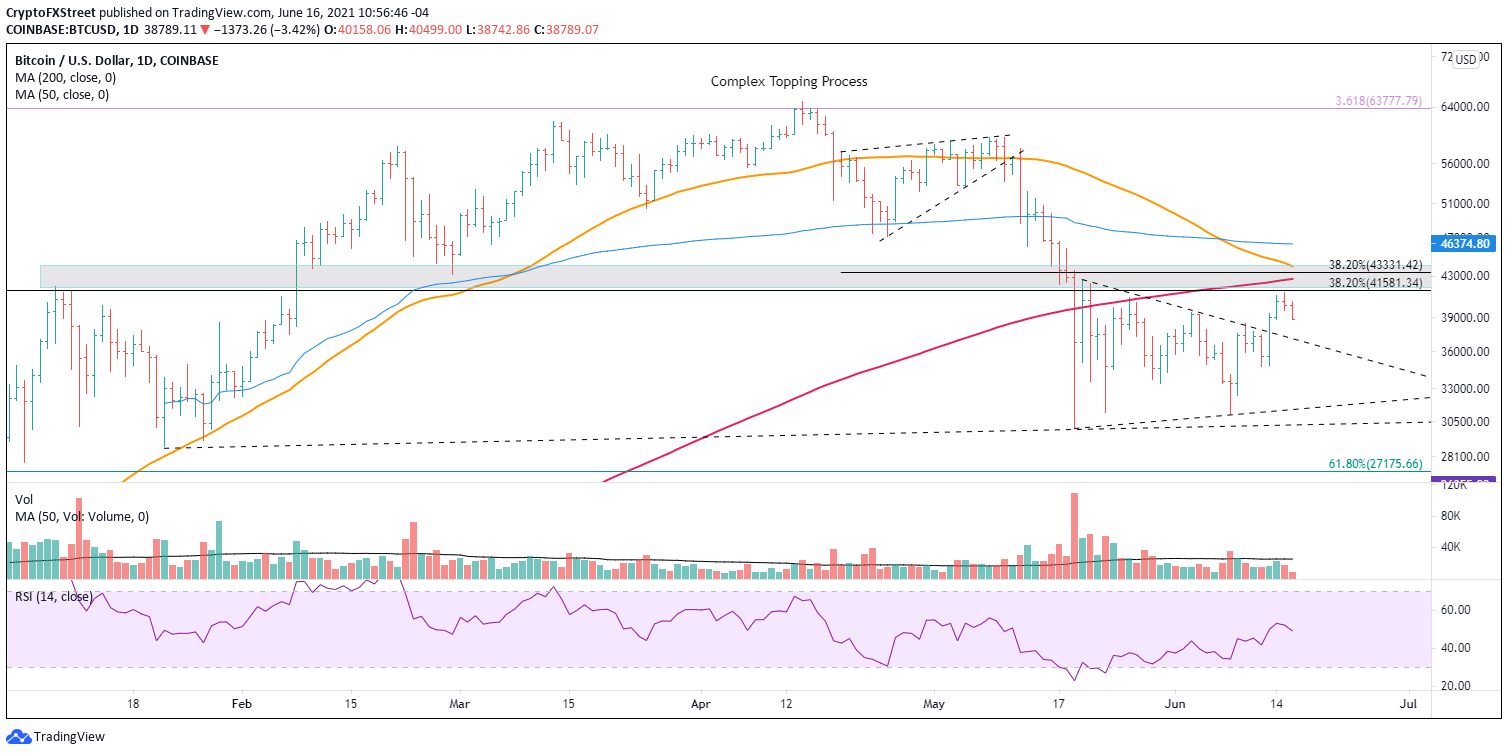
BTC/USD daily chart
On the downside, if Bitcoin price registers a daily close below the June 12 low of $34,635, it signifies that the rally attempt has failed, and BTC could retest the May 19 and 23 lows between $30,000-$31,000.
Recently, the highly followed Twitter handle, @100trillionUSD (Plan B), posted that their S2F(X) model and on-chain signal target a second leg for the bull market, taking Bitcoin price well over $100,000
Just to confirm: both my S2F(X) model and on-chain signal point towards a second run of this bull market pic.twitter.com/d8NB4jNoTL
— PlanB (@100trillionUSD) June 15, 2021
Not all models play out to perfection, but it is worthy of consideration as BTC tries to negotiate a firm low and a new advance.
For now, Bitcoin price will be humbled by intra-day swings as new support and resistance levels are tested, but BTC should make a couple of determined efforts to best the resistance mentioned above in the weeks ahead.
In the following video, FXStreet's analysts evaluate where Bitcoin could be heading as BTC technicals, and on-chain metrics turn bullish.
Ethereum price readies for trend confirmation
Ethereum price is resting on a symmetrical triangle’s lower trend line at $2,425. It is a pivotal point for today’s weakness and the potential resolution of the pattern. As a continuation pattern, the symmetrical triangle should have ETH investors positioned for a bearish outcome.
Confirmation of a pattern breakdown is a daily close below the June 12 low of $2,259 and the 50% retracement level of the March 2020-May 2021 advance at $2,237. If realized, Ethereum price is uncontested down to the merger of the November 20, 2020, anchored volume-weighted average price (anchored VWAP) at $1,840 with the 200-day SMA at $1,832, logging a 24% decline for the smart contracts giant.
A decline to the 200-day SMA may be motivated to include a brief sweep of the May 23 low of $1,728 before formalizing a firm BTC price low.
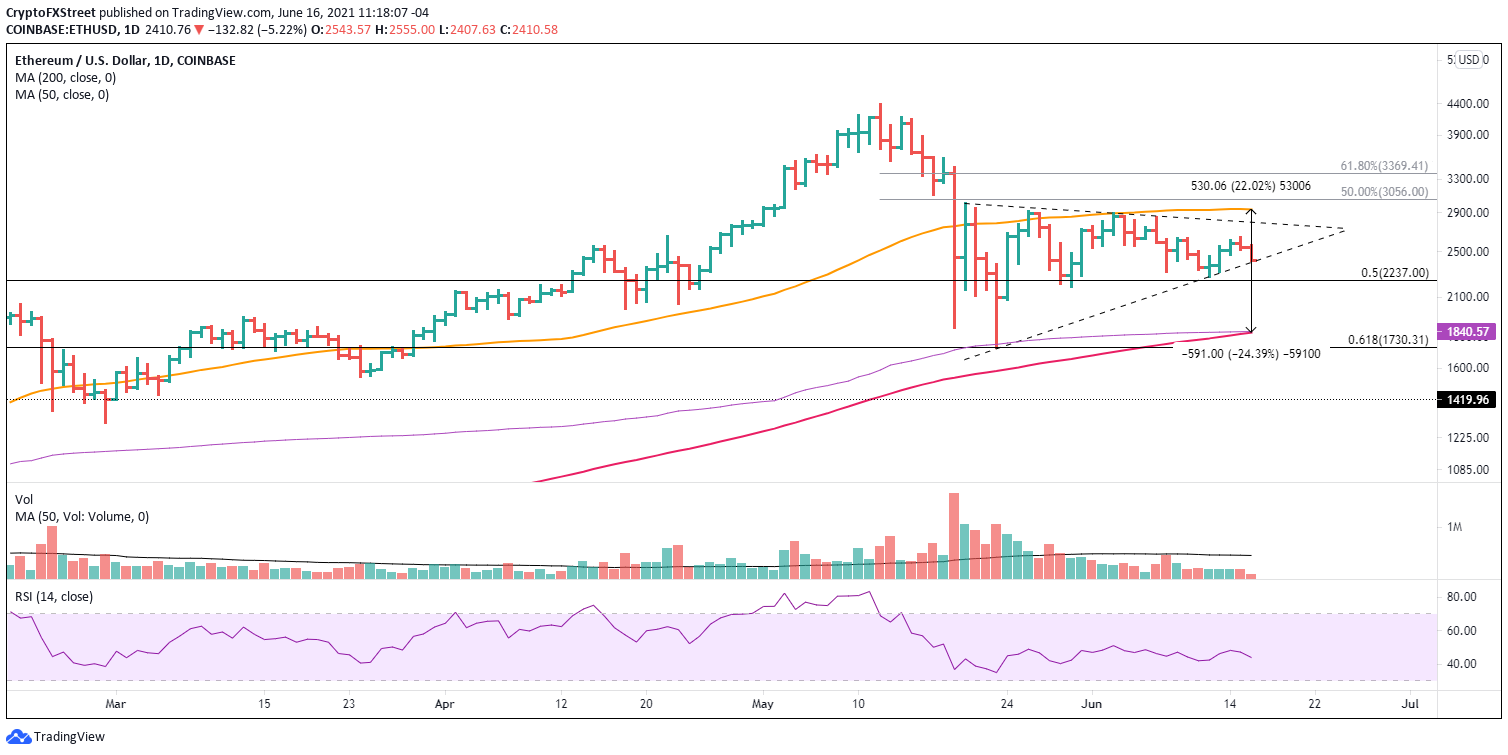
ETH/USD daily chart
Alternatively, Ethereum price may leverage a rebound from the triangle’s lower trend line and rise to the pattern’s upper trendline at $2,794, or even the 50-day SMA at $2,937, yielding a 22% for disciplined swing traders.
Today, Ethereum price has arrived at a pivotal point, putting ETH investors on notice that the symmetrical triangle may be on the verge of resolving to the downside in pursuit of a test of the May 23 low.
In the following video, FXStreet's analysts evaluate where Ethereum price could be heading next as ETH fails to break above crucial resistance.
XRP price has been content being range-bound, but it may be about to change
XRP price has demonstrated similar empathy and lack of direction as Ethereum price. Ripple has not been inspired by the 30% rally in Bitcoin price, instead favoring to be range-bound between the psychologically important $1.00 and the pervasive support offered by a multi-year inverse head-and-shoulders pattern neckline at $0.76.
The range has not generated signs of accumulation or distribution, raising the probability that XRP price may need to test the May 23 low to shake out the remaining weak holders from the international settlements token.
Complementing the bearish outlook is a complete head-and-shoulders pattern with a neckline close to $0.76, bolstering the inflection point’s importance.
Standing in front of the test of the May 23 of $0.65 is, of course, the $0.76 price level, followed quickly by the December 29, 2020, anchored VWAP at $0.74 and then the 200-day SMA at $0.72. Thus, a test of the May 23 low would yield a 20% decline from the current price
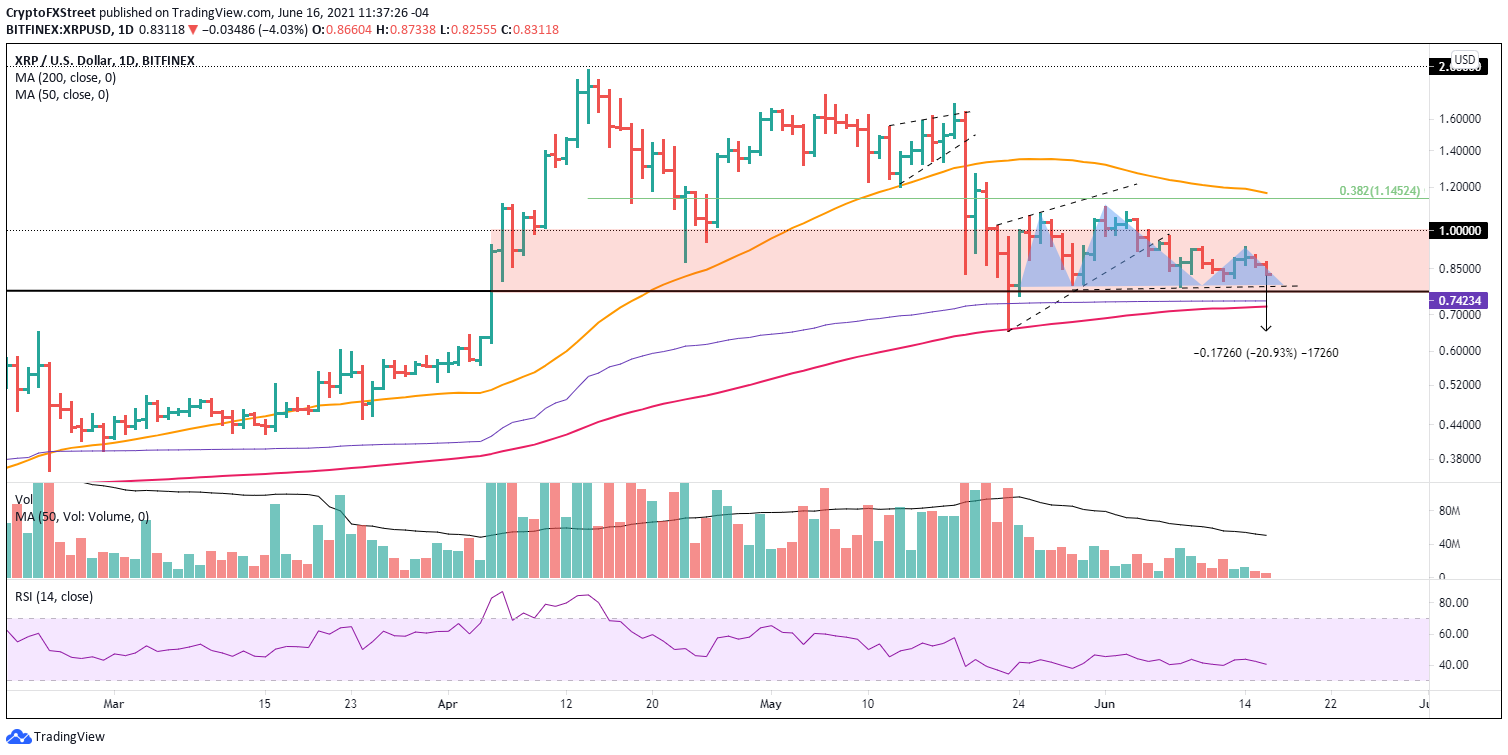
XRP/USD daily chart
On the flip side, only a daily close above $1.00 would promote a rethink of the bearish outlook.
Like many altcoins, Ethereum included, XRP price is near an inflection point that will likely define the price action moving forward.
In the following video, FXStreet's analysts evaluate where XRP price could be heading as Ripple flashes sell signal.
Author

Sheldon McIntyre, CMT
Independent Analyst
Sheldon has 24 years of investment experience holding various positions in companies based in the United States and Chile. His core competencies include BRIC and G-10 equity markets, swing and position trading and technical analysis.




