XRP price awaits 20% drop as Ripple breaks below critical level of support
- XRP price has formed a bearish outlook after breaking below the neckline of the head-and-shoulders pattern that has started to develop since late May.
- Ripple has failed to escape above the vital level of resistance at $0.79 and is now headed further south.
- While the cross-border remittance coin has been toying with the 200-day Simple Moving Average as support, only a close above this level could spare the cryptocurrency from a free fall of 20%.

XRP price has dropped over 11% over the weekend as Ripple fell in tandem with the leading cryptocurrency. The cross-border remittance coin has attempted to recover from the fall as it bounced from its swing low to retest the resistance level given from the recent bearish pattern formation.
XRP price undecided at critical level of support
XRP price has formed a minor head-and-shoulders pattern that started on May 23 on the daily chart. Now Ripple has broken below the bearish pattern, indicating that further losses are expected.
XRP price broke below the neckline of the head-and-shoulders pattern on June 18 for the first time, before a bearish close confirming the move to the downside the day after.
Since Ripple has fallen below the critical support level, a measured target of $0.57, a 20% drop from the current level, and a 28% decline from the neckline could be expected for the crypto asset. This target is given by measuring the top of the pattern to its neckline and subtracting it from the horizontal trend line.
However, Ripple would need to lose multiple areas of support before the furthermost bearish target would be met.
The 200-day Simple Moving Average (SMA) has acted as support for XRP as it is now testing the dependability of the indicator as it breaks below the line of defense for the second day.
If sellers continue to overpower buyers, Ripple could fall into the demand zone that starts at $0.65 before reaching the head-and-shoulders target of $0.57.
Now XRP appears to be trading around the 200-day SMA, and this level could play a significant role in determining the near future price moves for Ripple.
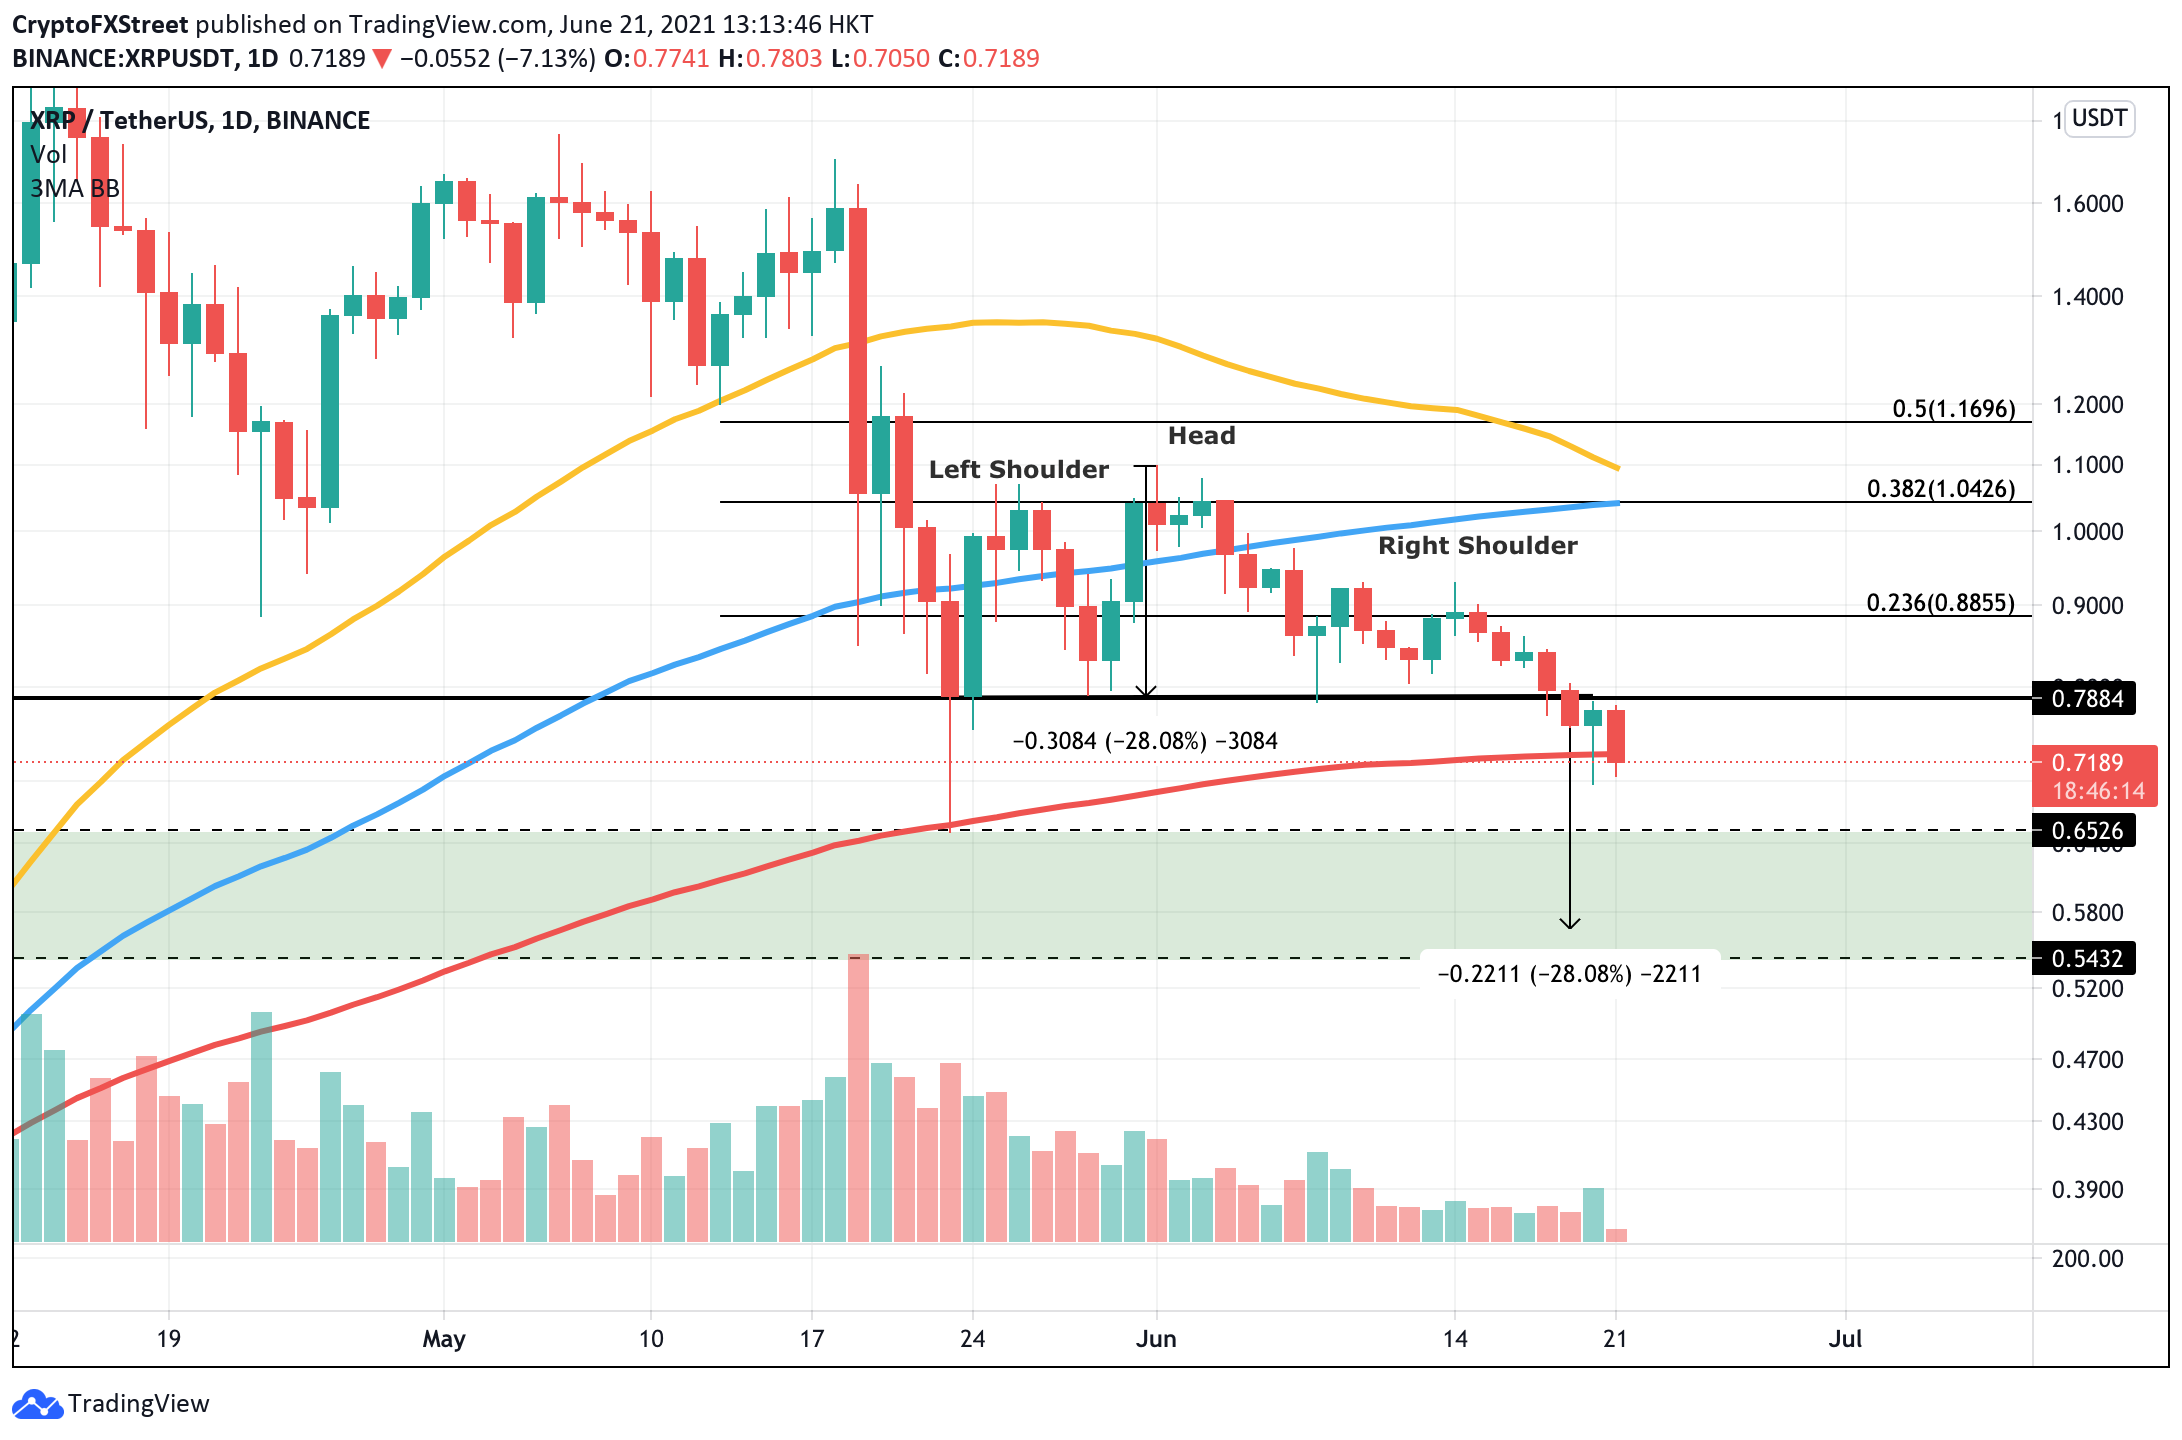
XRP/USDT daily chart
Should XRP bulls manage to lift prices higher, overthrowing the distribution of the sellers, Ripple would need to break and close above the first area of resistance, given by the neckline of the chart pattern at $0.78, before attempting to rally toward the 23.6% Fibonacci extension level at $0.89.
Investors should also note that if a rally were to occur as Ripple recovers, XRP price sees massive resistance ahead at the 38.2% Fibonacci extension level at $1.04, coinciding with the 100-day SMA.
Author

Sarah Tran
Independent Analyst
Sarah has closely followed the growth of blockchain technology and its adoption since 2016.


