- XRP price is set to breach the 200-DMA, with a test of May lows likely.
- Ripple confirmed a symmetrical triangle breakdown on the daily chart.
- The path of least resistance appears to down despite the tepid bounce.
XRP price is licking its wounds so far this Saturday, having reached the lowest in three months at $0.7691 on Friday.
Bulls are making recovery attempts across the crypto board, with the market sentiment seen improving slightly, in anticipation of the weekend love returning. Bitcoin has recaptured the $36,000 level after falling to just above $35,000 on Friday’s American afternoon.
The no.7 most-traded digital asset is also following a similar price movement. However, the further upside attempts appear elusive, despite the long-dragged SEC V. RIPPLE lawsuit.
The court denied the Securities Exchange Commission’s (SEC) request to search for records of Ripple’s General Counsel and Deputy General Counsel for being privileged communications.
Wednesday’s Fed’s hawkish surprise is likely to have a lasting impact across the asset classes.
XRP price looks south amid symmetrical triangle breakdown
The XRP price confirmed a downside breakout from a month-long symmetrical triangle formation on the daily chart a day before, as the bears yielded a daily closing below the rising trendline support, then at $0.8487.
A bearish break was inevitable, as the price has been forming lower highs on the said time frame.
Further, the Relative Strength Index (RSI) continues to trade listlessly below the midline, backing the downbeat mood around Ripple.
Therefore, a sustained break below Friday’s low at $0.7691 could expose the 200-Daily Moving Average (DMA) at $0.7277.
The May 23 low of $0.6509 could be put to test on a daily closing below the critical 200-DMA support.
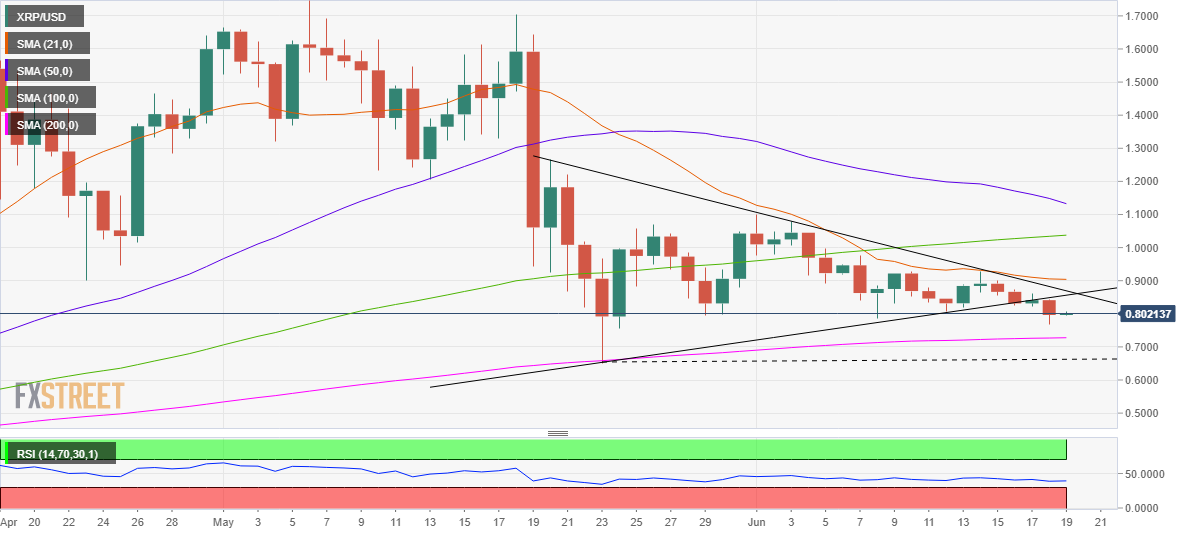
XRP/USD: Daily chart
On the upside, the road to recovery could be challenged by the triangle support now resistance at $0.8562.
The buyers will then look to regain the $0.8600 round number, above which the triangle resistance at $0.8869.
A convincing break above the last is likely to invalidate the symmetrical triangle breakdown.
XRP/USD: Additional technical levels to consider
Information on these pages contains forward-looking statements that involve risks and uncertainties. Markets and instruments profiled on this page are for informational purposes only and should not in any way come across as a recommendation to buy or sell in these assets. You should do your own thorough research before making any investment decisions. FXStreet does not in any way guarantee that this information is free from mistakes, errors, or material misstatements. It also does not guarantee that this information is of a timely nature. Investing in Open Markets involves a great deal of risk, including the loss of all or a portion of your investment, as well as emotional distress. All risks, losses and costs associated with investing, including total loss of principal, are your responsibility. The views and opinions expressed in this article are those of the authors and do not necessarily reflect the official policy or position of FXStreet nor its advertisers. The author will not be held responsible for information that is found at the end of links posted on this page.
If not otherwise explicitly mentioned in the body of the article, at the time of writing, the author has no position in any stock mentioned in this article and no business relationship with any company mentioned. The author has not received compensation for writing this article, other than from FXStreet.
FXStreet and the author do not provide personalized recommendations. The author makes no representations as to the accuracy, completeness, or suitability of this information. FXStreet and the author will not be liable for any errors, omissions or any losses, injuries or damages arising from this information and its display or use. Errors and omissions excepted.
The author and FXStreet are not registered investment advisors and nothing in this article is intended to be investment advice.
Recommended Content
Editors’ Picks

Top 3 Price Prediction Bitcoin, Ethereum, Ripple: BTC consolidates while ETH and XRP show some strength
Bitcoin (BTC) consolidated between $94,000 and $100,000 in the last nine days. Ethereum (ETH) and Ripple (XRP) prices stood relatively stronger and have gained nearly 3% and 7%, respectively, this week.

Trump's US reciprocal tariffs pause fails to improve Bitcoin and crypto market outlook
Bitcoin (BTC) and top cryptos halted their declines following a pause in President Donald Trump's reciprocal tariff plans, which were originally scheduled to go live on Thursday.

Ripple vs SEC battle nears end as the regulator acknowledges Grayscale XRP ETF filing
Ripple's XRP is up 4% in the early hours of Friday following the Securities and Exchange Commission (SEC) acknowledgment of Grayscale's 19b-4 filing to convert its XRP Trust to an ETF.

200,000 New Investors Buy Ripple (XRP) 30-Days After Gensler’s Farewell: What Next for Stellar (XLM)?
Ripple (XRP) price consolidated around $2.40 on Thursday, up 11% since Monday, technical indicators suggest Stellar (XLM) has joined the rally.

Bitcoin: BTC consolidates before a big move
Bitcoin's (BTC) price has been consolidating between $94,000 and $100,000 for the last ten days, and, when writing on Friday, it hovers around $97,000. Despite this consolidation, US Bitcoin spot Exchange Traded Funds (ETFs) data recorded a total net outflow of $650.80 million until Thursday, hinting signs of weakness among institutional investors.

The Best Brokers of the Year
SPONSORED Explore top-quality choices worldwide and locally. Compare key features like spreads, leverage, and platforms. Find the right broker for your needs, whether trading CFDs, Forex pairs like EUR/USD, or commodities like Gold.