XLM price to experience déjà vu if Stellar breaks below $0.25
- XLM price nears the apex of a symmetrical triangle continuation pattern that has been forming since June 21.
- Stellar failing to hold the critical support at the 50-week simple moving average (SMA).
- The oversold condition in June has not evolved into a substantive rally in XLM price.

XLM price is nearing the latter stage of a symmetrical triangle pattern formed in response to the noteworthy oversold condition on the daily Relative Strength Index (RSI). As a continuation pattern, the probabilities are tilted towards a bearish resolution and potentially a new low for Stellar.
XLM price has nowhere to go, but down
XLM price closed 2Q down almost 30%, making it the worst quarter since 3Q2019. The overall decline of 75% from the May 16 high of $0.797 was highlighted by a May 19 loss of 29% and a June 20 loss of 20%.
Since the June 22 low of $0.198, XLM price has been coiling in a symmetrical triangle pattern, releasing the oversold condition but not revealing many clues as to the directional intentions of Stellar moving forward.
Two levels have been pivotal to XLM price during the development of the symmetrical triangle; the May 23 low of $0.274 and the exacting 50-week SMA at $0.269. Combined, they have served as a magnet for Stellar, sometimes offering resistance and other times providing support.
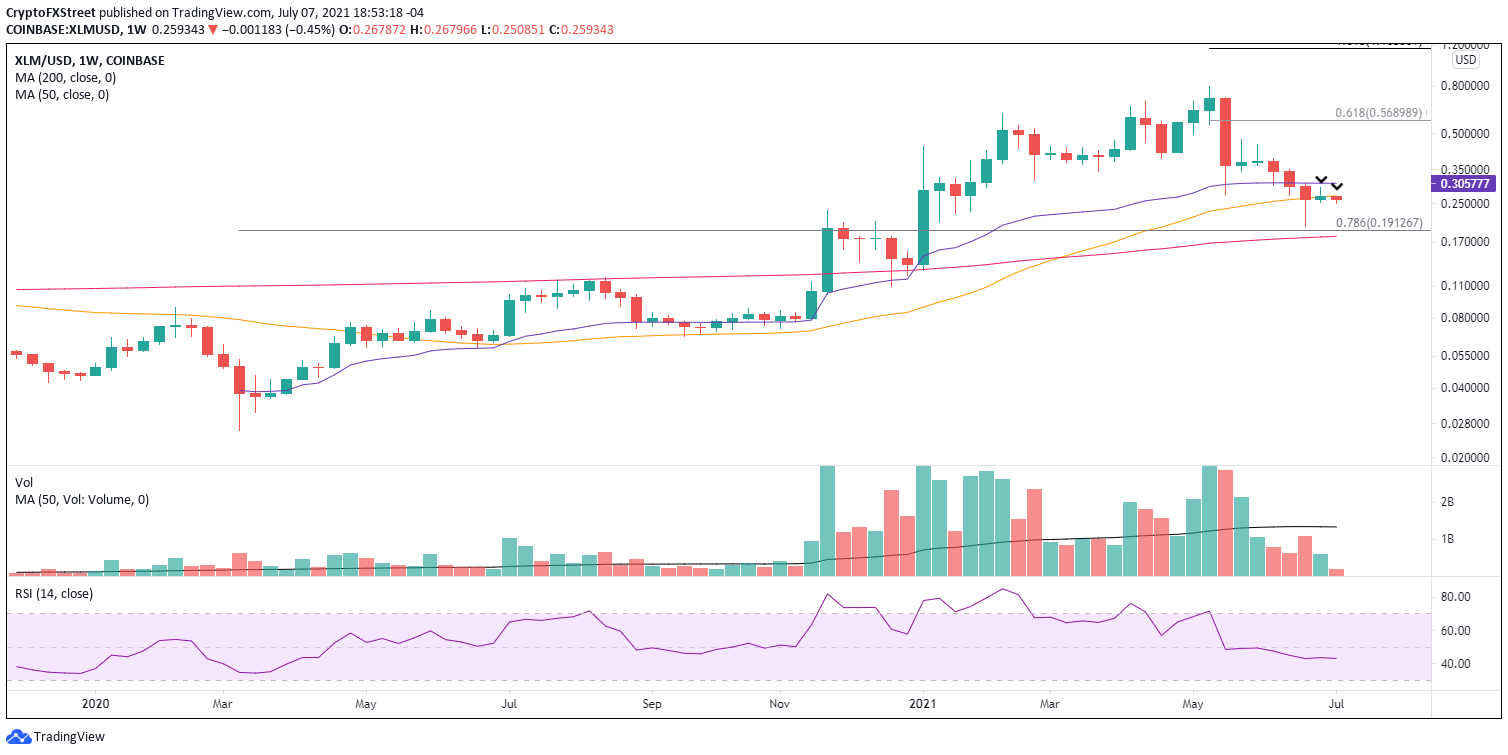
XLM/USD weekly chart
The measured move of the symmetrical triangle is 50%, projecting a final XLM price of $0.127. It would erase most of the 2021 gains and generate a loss of over 80% from the May high.
A more reasonable and higher probability scenario is for XLM price to sweep below the June 22 low of $0.198 and bottom in the vicinity of the 78.6% Fibonacci retracement of the March 2020-May 2021 advance at $0.191. It would represent a 25% decline from the current price.
To trigger the symmetrical triangle pattern, XLM needs to trade below $0.250. Selling should accelerate after that, as the 50-week SMA and the bearish Death Cross pattern press on Stellar.
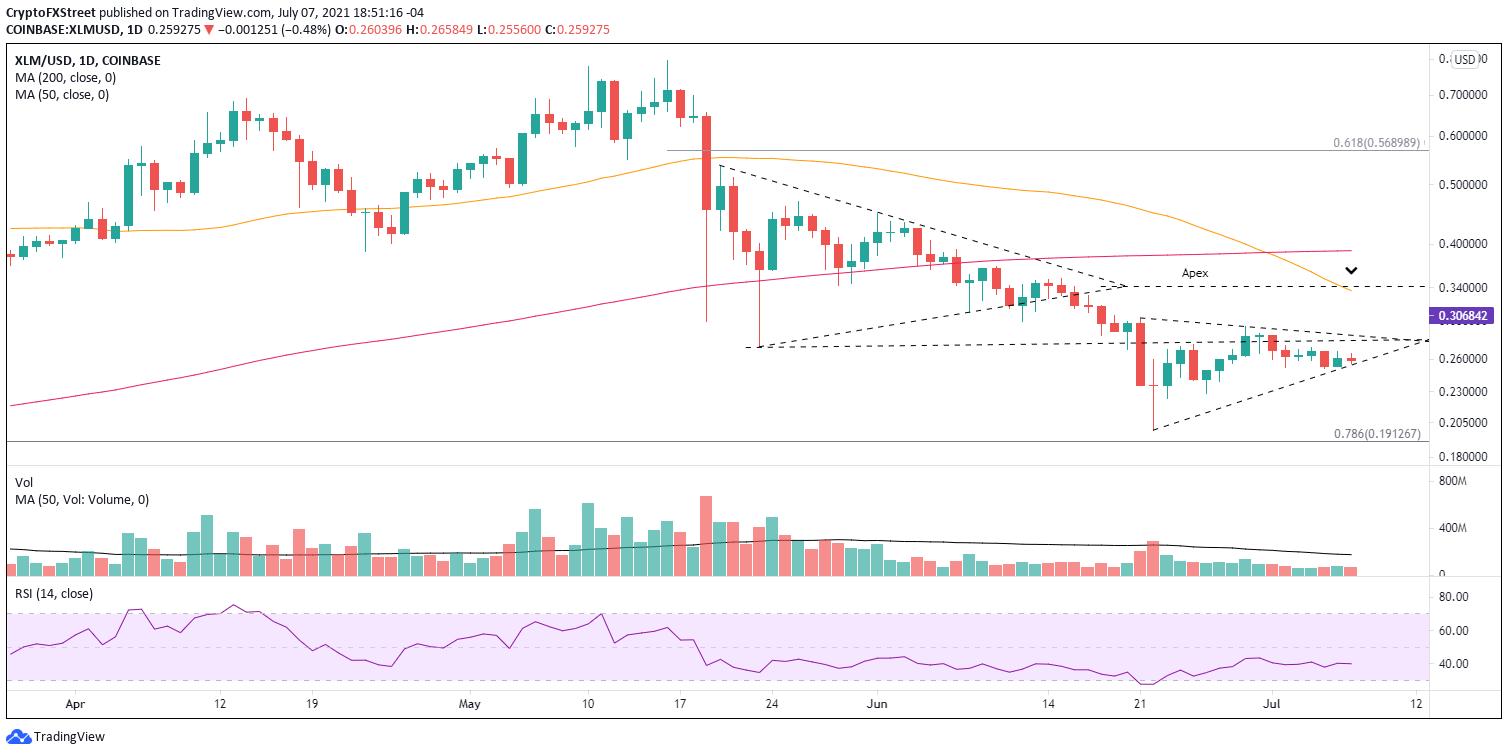
XLM/USD daily chart
XLM price can avoid the bearish thesis with a daily close above the union of the May 23 low of $0.274 with the triangle’s upper trend line, currently at $0.284. If successful, Stellar may rally to the declining 50-day SMA at $0.336 or the apex of the previous symmetrical triangle at $0.343.
To review, XLM price designed a symmetrical triangle following the crash in May, and as a continuation pattern, Stellar resolved to the downside with a 40% decline in June. Now it has plotted another symmetrical triangle following a drop. If precedent holds, XLM price is about to have a moment of déjà vu.
The bottom line is that Stellar investors need to be prepared for the third leg down of the correction that began in May.
Author

Sheldon McIntyre, CMT
Independent Analyst
Sheldon has 24 years of investment experience holding various positions in companies based in the United States and Chile. His core competencies include BRIC and G-10 equity markets, swing and position trading and technical analysis.


