|

XLM Price Prediction: Stellar future is decided by these two key levels

  • On the 4-hour chart, Stellar price has formed a massive symmetrical triangle pattern.
  • XLM is on the verge of a colossal 45% move decided by two levels.
  • The digital asset will see a significant breakout or breakdown within the next three days.

XLM has been under a massive consolidation period since the beginning of February and it’s on the verge of a colossal 45% move. The trading volume of Stellar has dropped significantly which indicates that it is ready for the next transition.

Stellar price on the verge of a 45% move

On the 4-hour chart, the most critical pattern is the symmetrical triangle formed between the upper trendline at $0.43 and the lower boundary at $0.37. These are the two most important levels for XLM.

xlm price

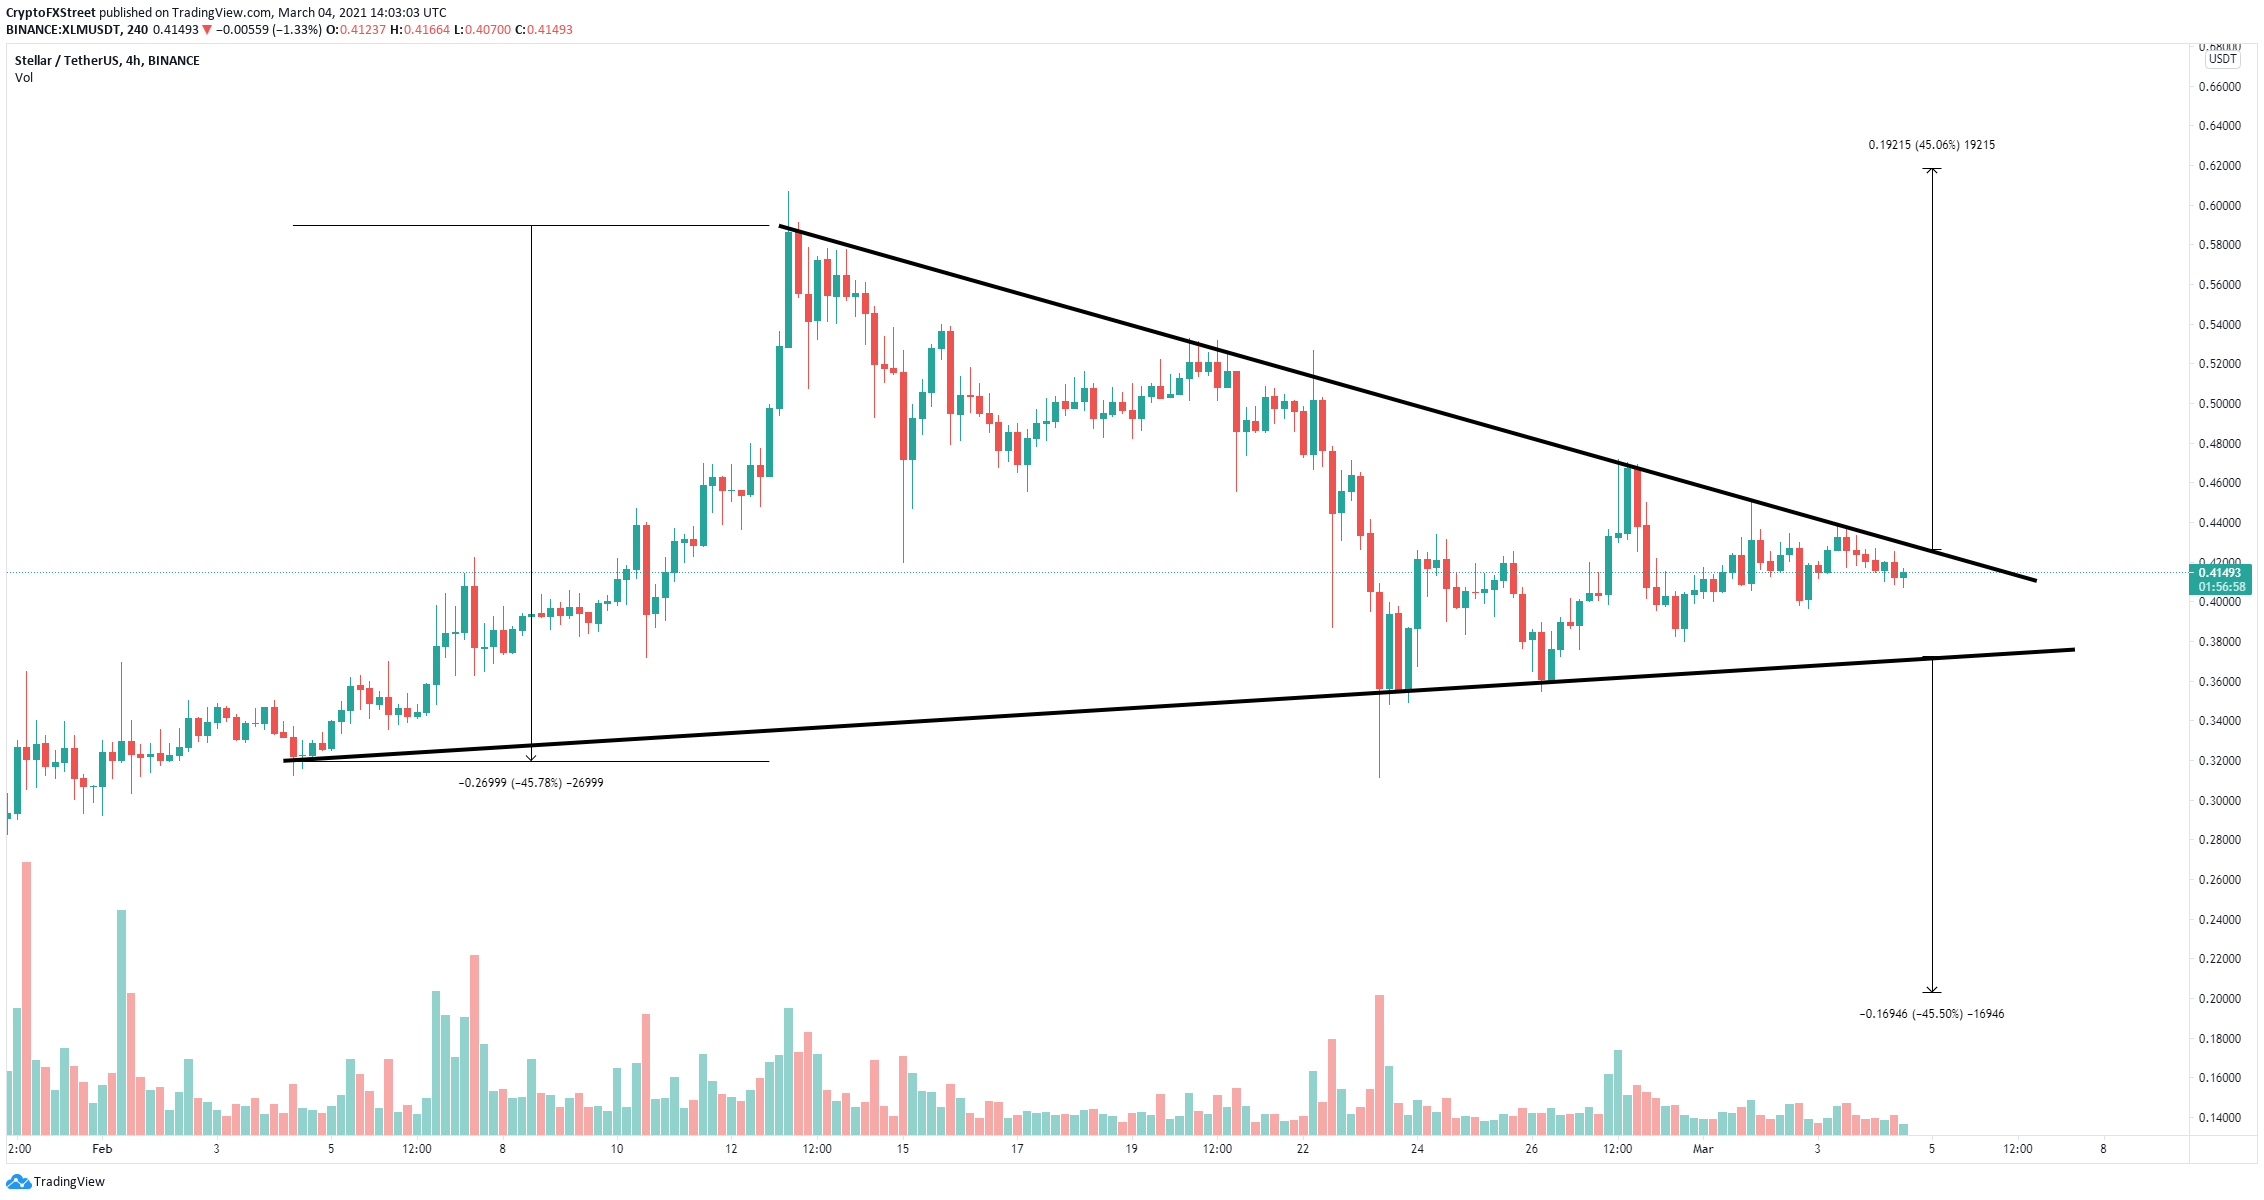
XLM/USD 4-hour chart

A breakout above the upper resistance level at $0.43 would drive Stellar price towards $0.62, a new 2021-high. XLM is currently trading at $0.415, closer to a breakout than a breakdown, giving better odds to the bulls. 

On the other hand, if the resistance level at $0.43 rejects Stellar, the digital asset will fall towards the lower boundary at $0.37. A breakdown below this point should also push Stellar price by 45% down to $0.2.

Author

Lorenzo Stroe

Lorenzo Stroe

Independent Analyst

Lorenzo is an experienced Technical Analyst and Content Writer who has been working in the cryptocurrency industry since 2012. He also has a passion for trading.

More from Lorenzo Stroe
Share:

Editor's Picks

XRP and XLM outlook: Fragile recovery as traders favor downside

Ripple and Stellar remain under pressure on Tuesday after a mild recovery following a massive correction in the previous week. Weakening derivatives positioning, alongside mixed on-chain data for both XRP and XLM, suggests that any recovery rallies are likely viewed as corrective within a broader bearish context. Derivatives data shows a bearish tilt.

Crypto Overview: Zcash, Terra Classic sustain gains amid broader market risk-off phase

The broader cryptocurrency market remains under pressure, with Bitcoin trading around $62,000 on Tuesday, while market-wide Open Interest stabilizes after hitting a two-month low. Reduced leverage exposure reflects a risk-off phase, as supported by the Fear and Greed Index, which indicates extreme fear in the market.

Tokenized RWAs surge 589% despite crypto market pullback in May

Crypto market sectors real-world assets and quantum-resistant cryptocurrencies recorded notable gains despite broader macroeconomic pressures, according to a Binance Research report on Monday. The report stated that the total crypto market cap declined 3.3% in May to $2.55 trillion as inflation concerns, rising bond yields and shifting expectations for Fed policy weighed on risk assets.

Ethereum Price Forecast: BitMine makes largest ETH purchase in 2026 amid price decline
Ethereum (ETH) treasury firm BitMine Immersion Technologies (BMNR) acquired 126,971 ETH last week following the top altcoin's decline toward the $1,500 region. The purchase, which represents its largest weekly ETH acquisition in 2026, has pushed the company's holdings to 5.54 million ETH.
Bitcoin: After the bloodbath, everyone looks at $60,000
Bitcoin (BTC) hovers above $62,000 at the time of writing on Friday, weighed down by growing risk-off sentiment due to persistent geopolitical tensions in the Middle East and sticky macroeconomic uncertainty. The institutional sell-off continued to wreak havoc on capital flows, with spot Bitcoin Exchange-Traded Funds (ETFs) recording billions in outflows.