XLM Price Prediction: Stellar is at risk of diving towards $0.30, suggest technicals
- XLM price has been trading inside a robust uptrend since January 27.
- The digital asset faces strong resistance in the short-term and could fall to $0.30.
- A crucial indicator has presented several sell signals for Stellar.

Stellar is up by 80% since its low established on January 27 at $0.23. The digital asset has topped out at $0.4225 on February 7, establishing a potential double top on the 12-hour chart.
XLM price can quickly fall to $0.30 according to various indicators
The TD Sequential indicator has presented a sell signal on the 9-hour chart and it’s on the verge of doing the same on the 12-hour chart. The first call hasn’t been validated just yet but adds credence to the potential next sell signal on the 12-hour chart.
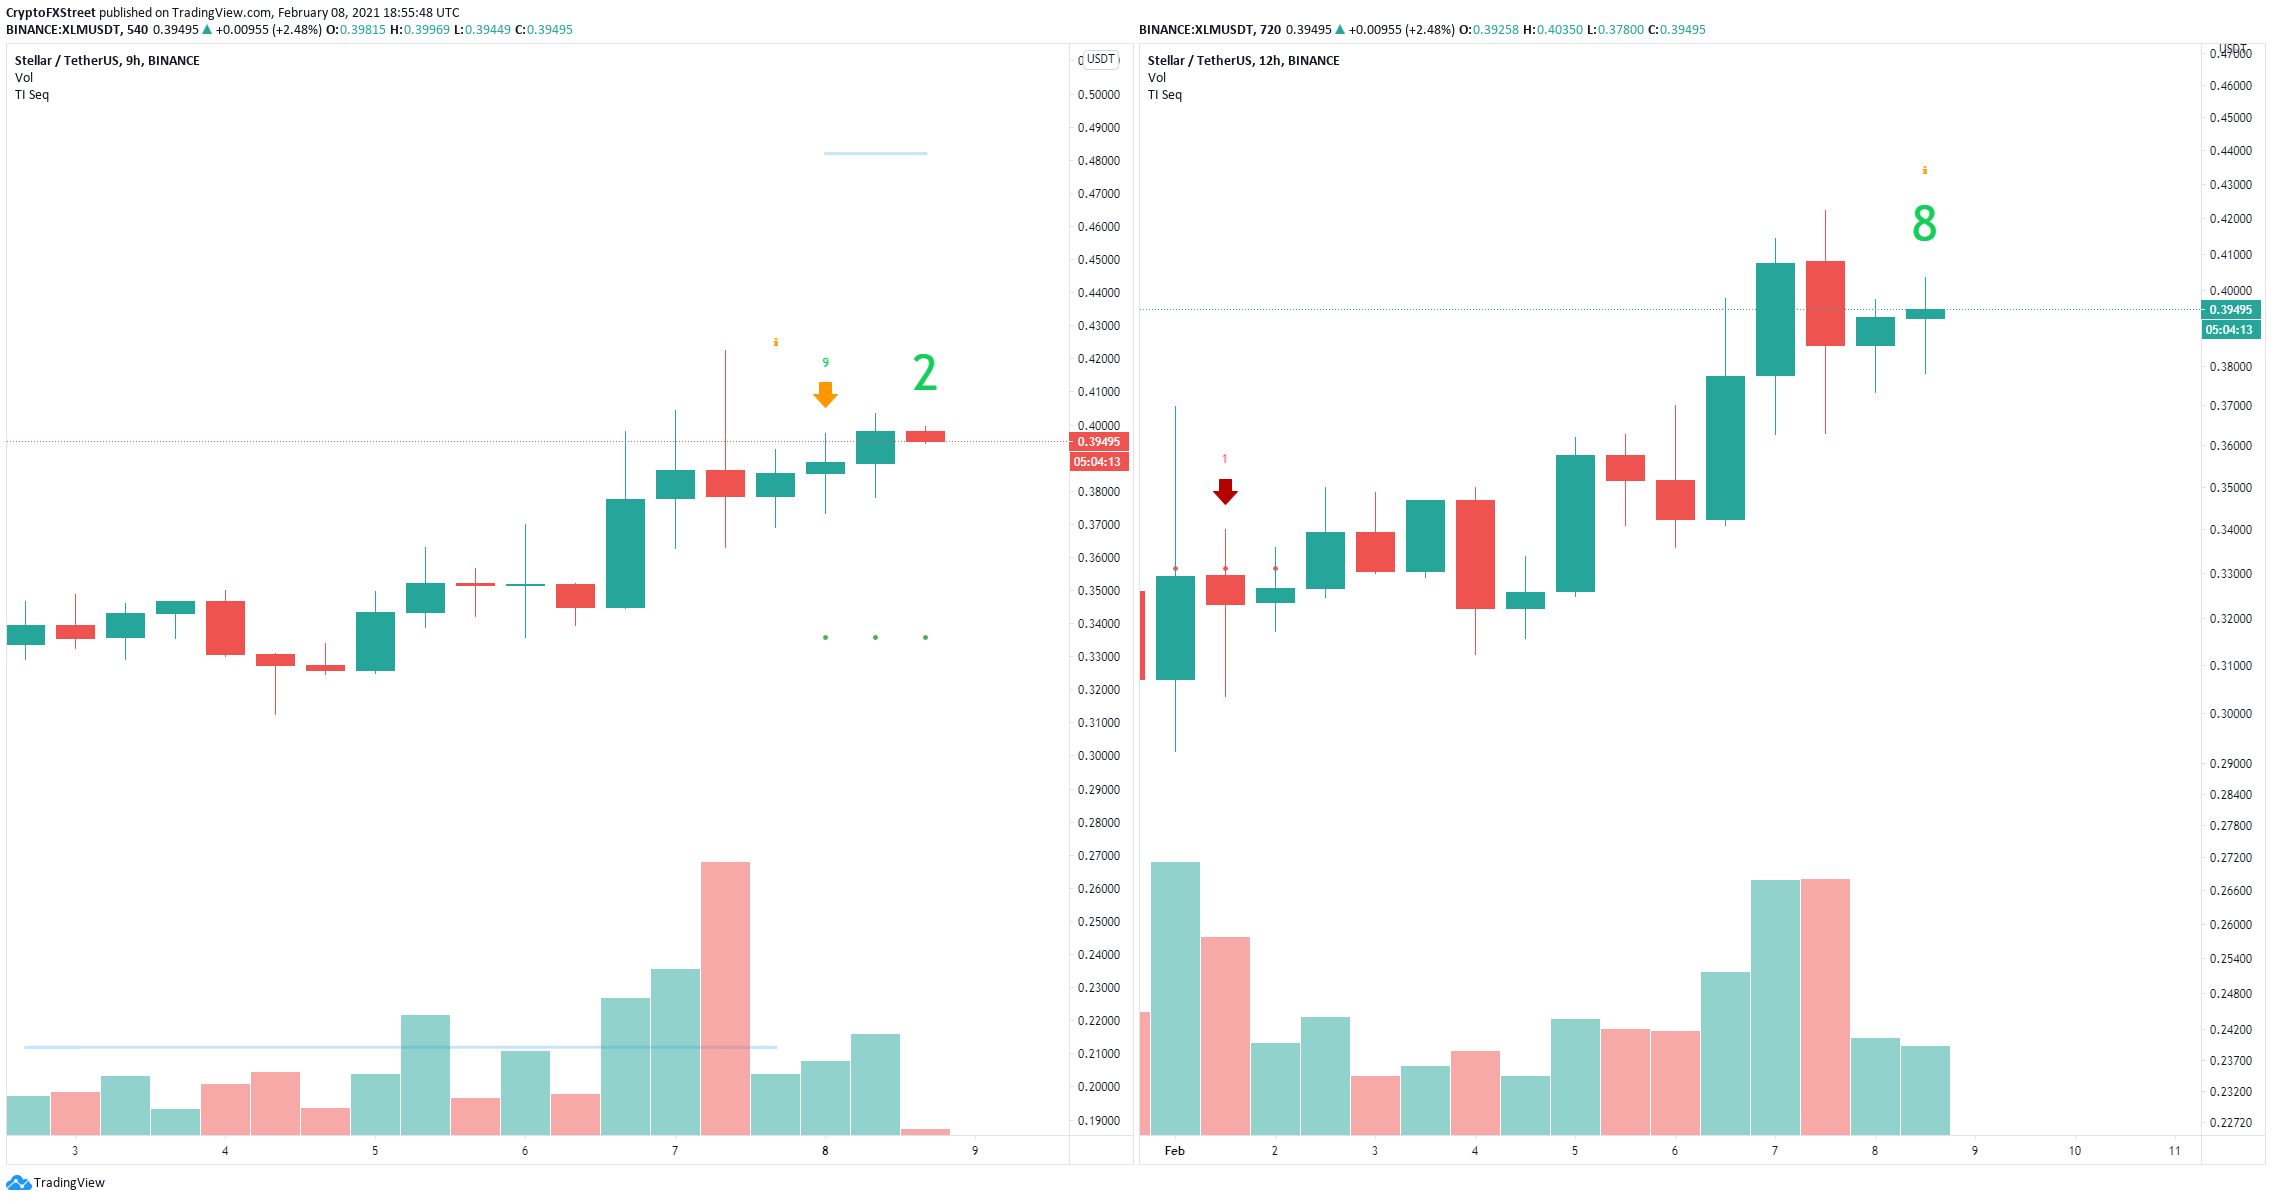
XLM Sell Signals
On the 12-hour chart, XLM has been trading above the 26-EMA since January 28 holding this support level significantly. A breakdown below the 26-EMA, currently located at $0.366 would be notable.
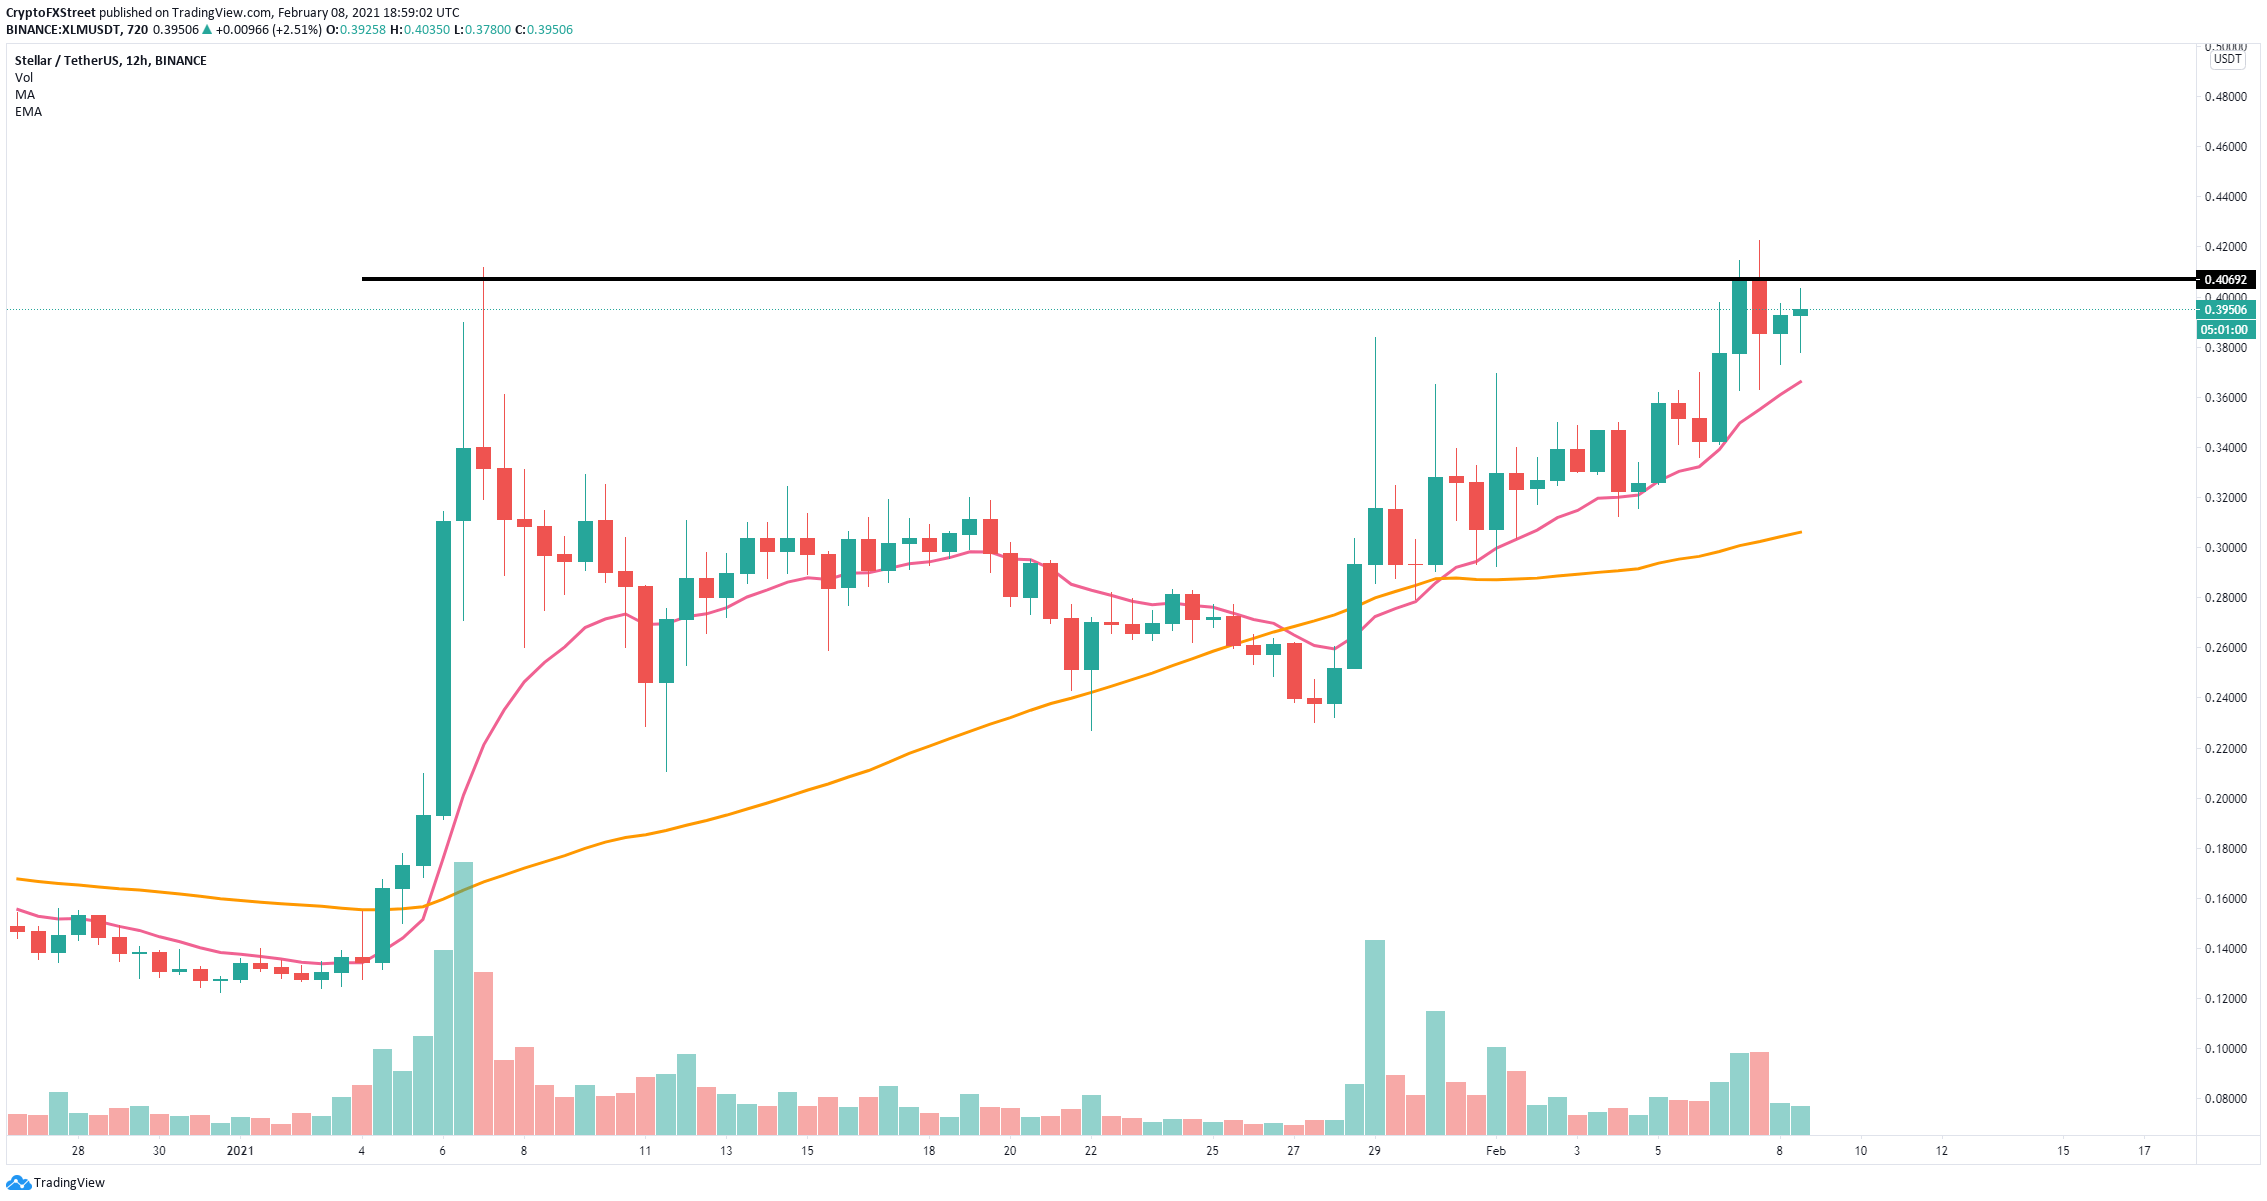
XLM/USD 12-hour chart
Losing $0.366 could quickly push XLM price towards the 50-SMA support level established at $0.30. This is the most likely scenario in the short-term due to the sell signals presented by the TD Sequential indicator.
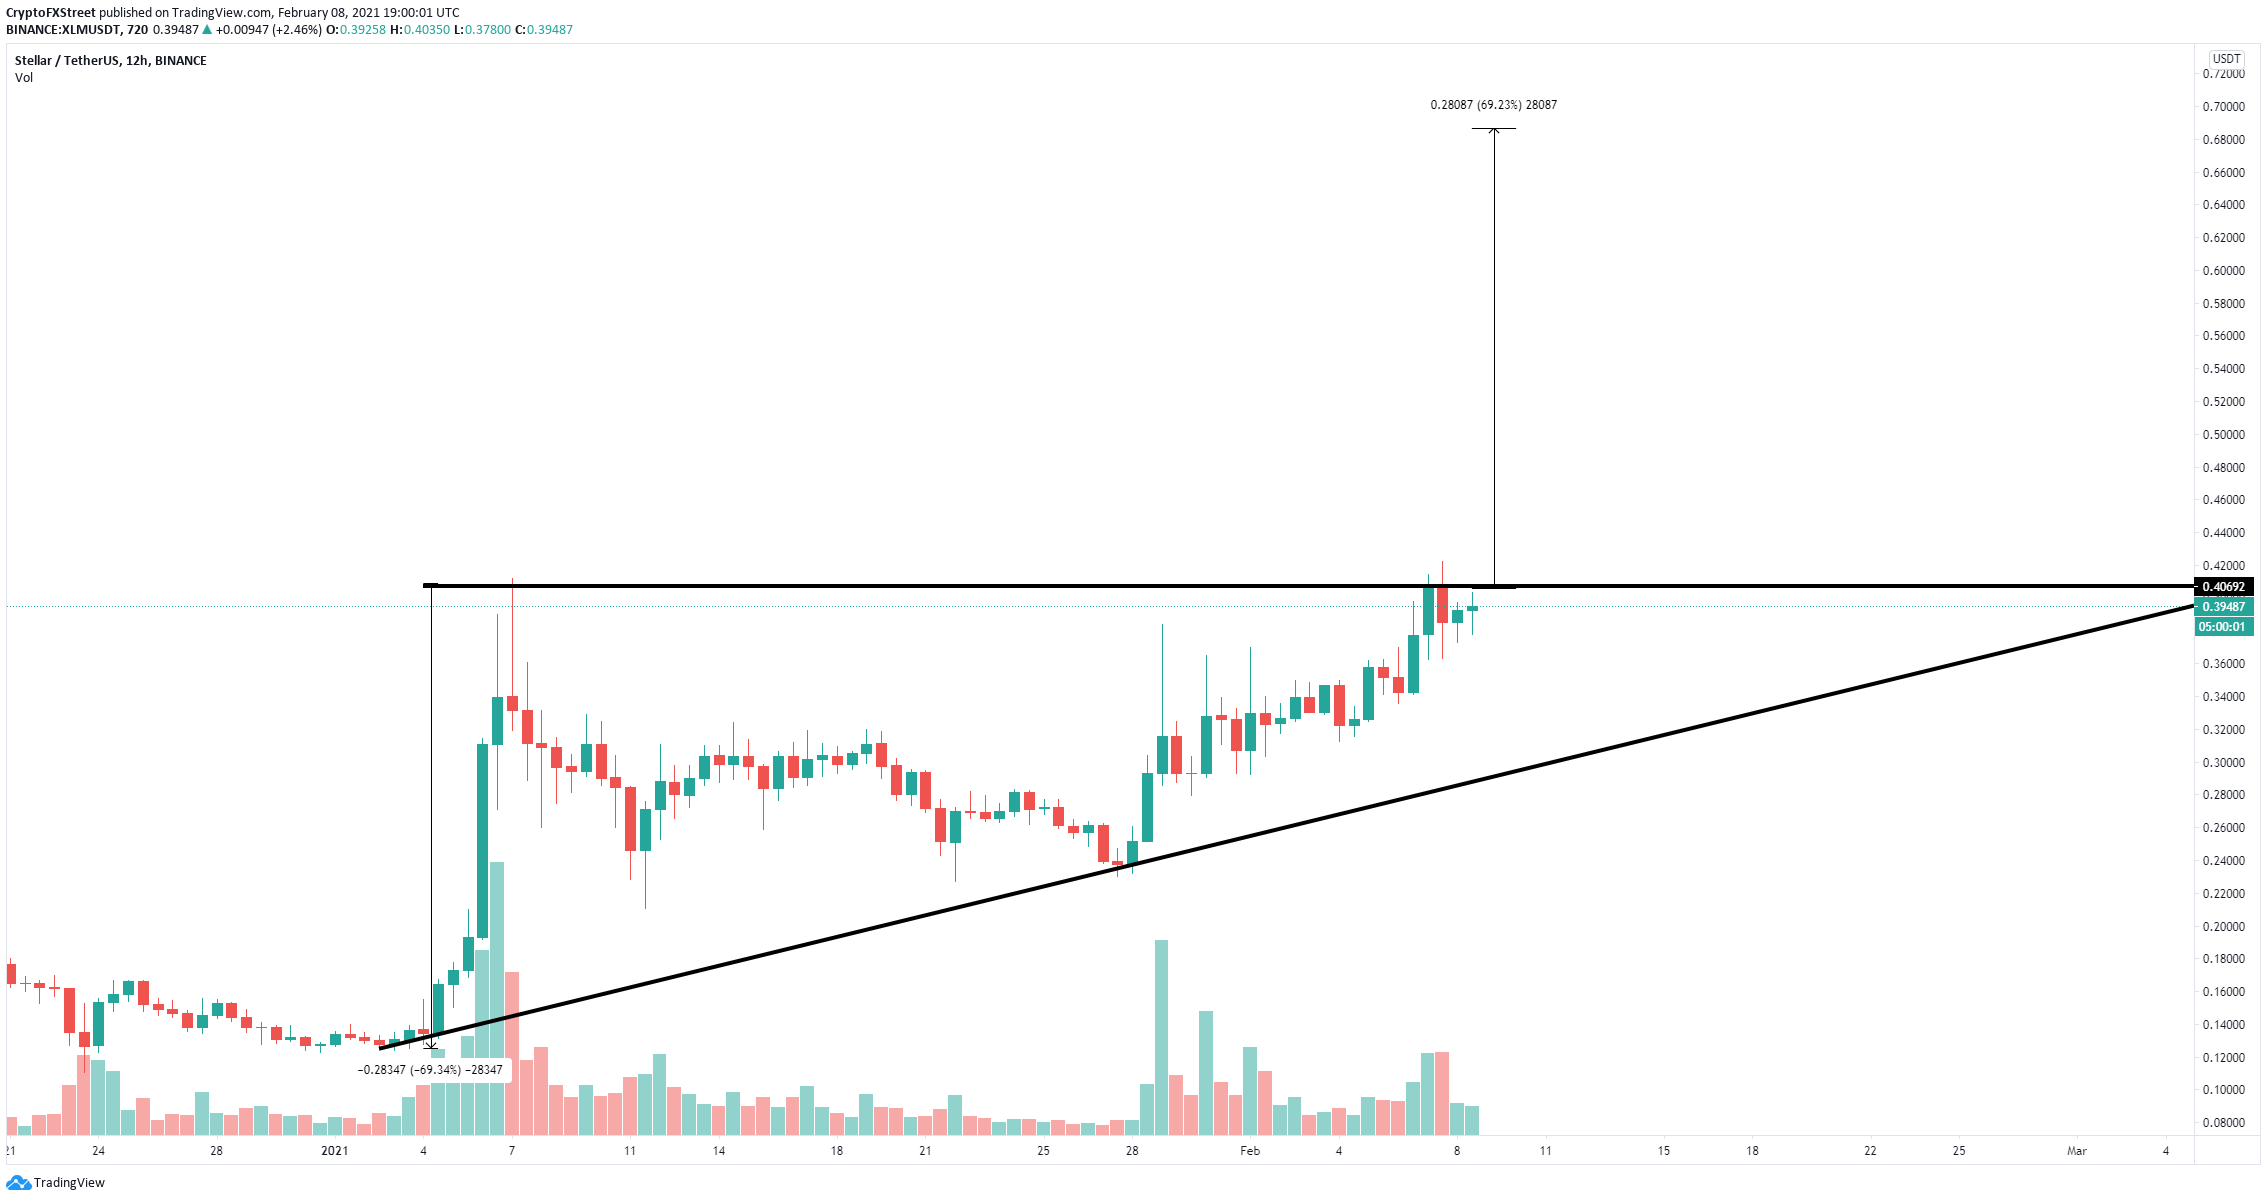
XLM/USD 12-hour chart
However, bulls can invalidate the bearish outlook by pushing XLM price above $0.40 decisively. There is an ascending triangle pattern formed on the 12-hour chart. A breakout above the upper trendline could drive XLM towards a high of $0.70.
Author

Lorenzo Stroe
Independent Analyst
Lorenzo is an experienced Technical Analyst and Content Writer who has been working in the cryptocurrency industry since 2012. He also has a passion for trading.


