XLM Price Prediction: Stellar draws nigh to a 32% move amid improving technical picture
- Stellar seems ready to liftoff and push the rally to another level due to a key technical formation.
- A symmetrical triangle on the 4-hour chart points towards $0.5, but the seller congestion at $0.4 must be dispersed.
- Consolidation is likely to last longer, as reinforced by the RSI.

Stellar has in the past week incurred 35% in gains. While this move may seem insignificant compared to tokens like XRP and DOGE, XLM has sustained its uptrend.
Notably, a barrier at $0.4 temporarily paused the upsurge, but the cross-border token appears to have established robust support above $0.3. For now, consolidation is dominant, but XLM is getting closer to a massive technical move.
Stellar eyes $0.5 on breaking crucial resistance
XLM is exchanging hands at $0.33 at the time of writing. The ongoing consolidation has dominated the market since the rejection at $0.4. However, a newly formed golden cross pattern on the 4-hour chart suggests that bulls are back in control.
A golden cross pattern occurs when a short-term moving average (in this case, the 50 SMA) crosses above a longer-term moving average (100 SMA). The technical formation reveals that the bears' influence is diminishing while the bulls prepare to take over.
A comprehensive look at the same chart illustrates the formation of a symmetrical triangle pattern. This pattern shows a period of consolidation after a massive price action. It can lead to either a breakout or a breakdown, which occur before the trendlines cross.
It is worth noting that a breakout happens when the price crosses above the upper trendline. On the contrary, a breakdown comes into play when the price slides under the lower trendline.
Realize that symmetrical triangles have clear breakout or breakdown targets, measured from the highest to the pattern's lowest points. If Stellar can sustain the uptrend above $0.35, an upswing to $0.5 is very likely.
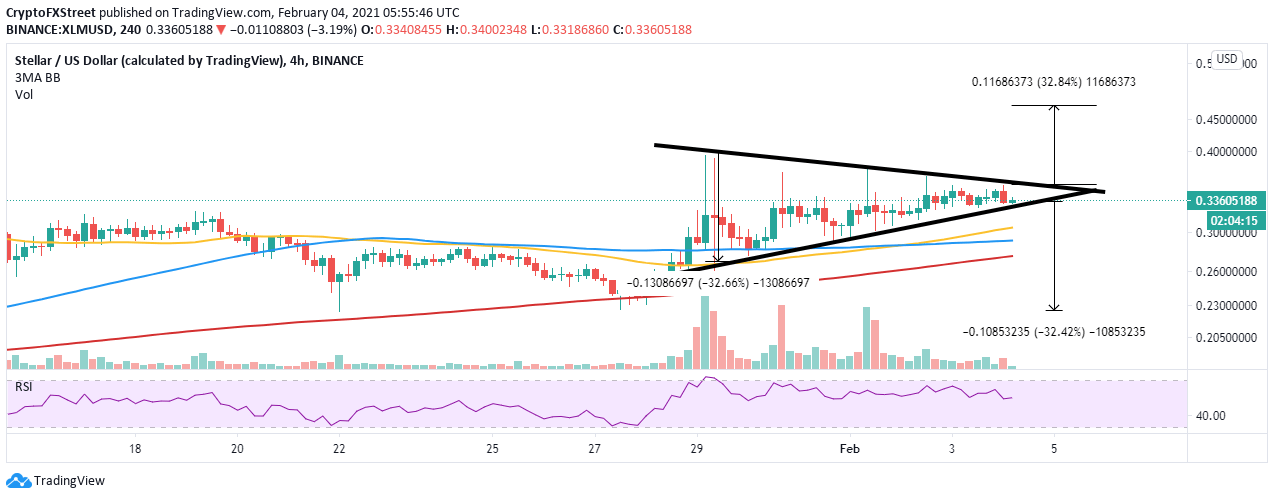
XLM/USD 4-hour chart
Looking at the other side of the picture
Stellar's consolidation may last longer than expected, mostly if the resistance at $0.35 stays in place. Moreover, the Relative Strength Index seems to validate the current sideways trading in the same 4-hour timeframe.
On the downside, a break under the symmetrical triangle could culminate in losses toward $0.2. Some support levels to keep in mind include the 50 SMA at $0.3 and the 200 SMA at $0.275.
Author

John Isige
FXStreet
John Isige is a seasoned cryptocurrency journalist and markets analyst committed to delivering high-quality, actionable insights tailored to traders, investors, and crypto enthusiasts. He enjoys deep dives into emerging Web3 tren


