|

Stellar Price Forecast: XLM edges closer to a bullish explosive impulse

  • Stellar price is contained inside an ascending parallel channel on the 4-hour chart.
  • The digital asset faces one critical resistance level before a move towards $0.41.
  • There is one indicator that suggests XLM might need to see a correction first before another leg up.

Stellar has been trading inside a strong uptrend for the past week and it’s on the verge of another significant breakout in the short-term. The digital asset has reached a market capitalization of $8 billion and aims to overtake Bitcoin Cash for the 10th place. 

Stellar price can promptly jump to $0.41 if this level cracks

On the 4-hour chart, Stellar has established an ascending parallel channel with a resistance point located at $0.362. Breaking above this level will drive Stellar price towards a high of $0.41, a 13% move determined by using the height of the pattern as a reference point. 

xlm price

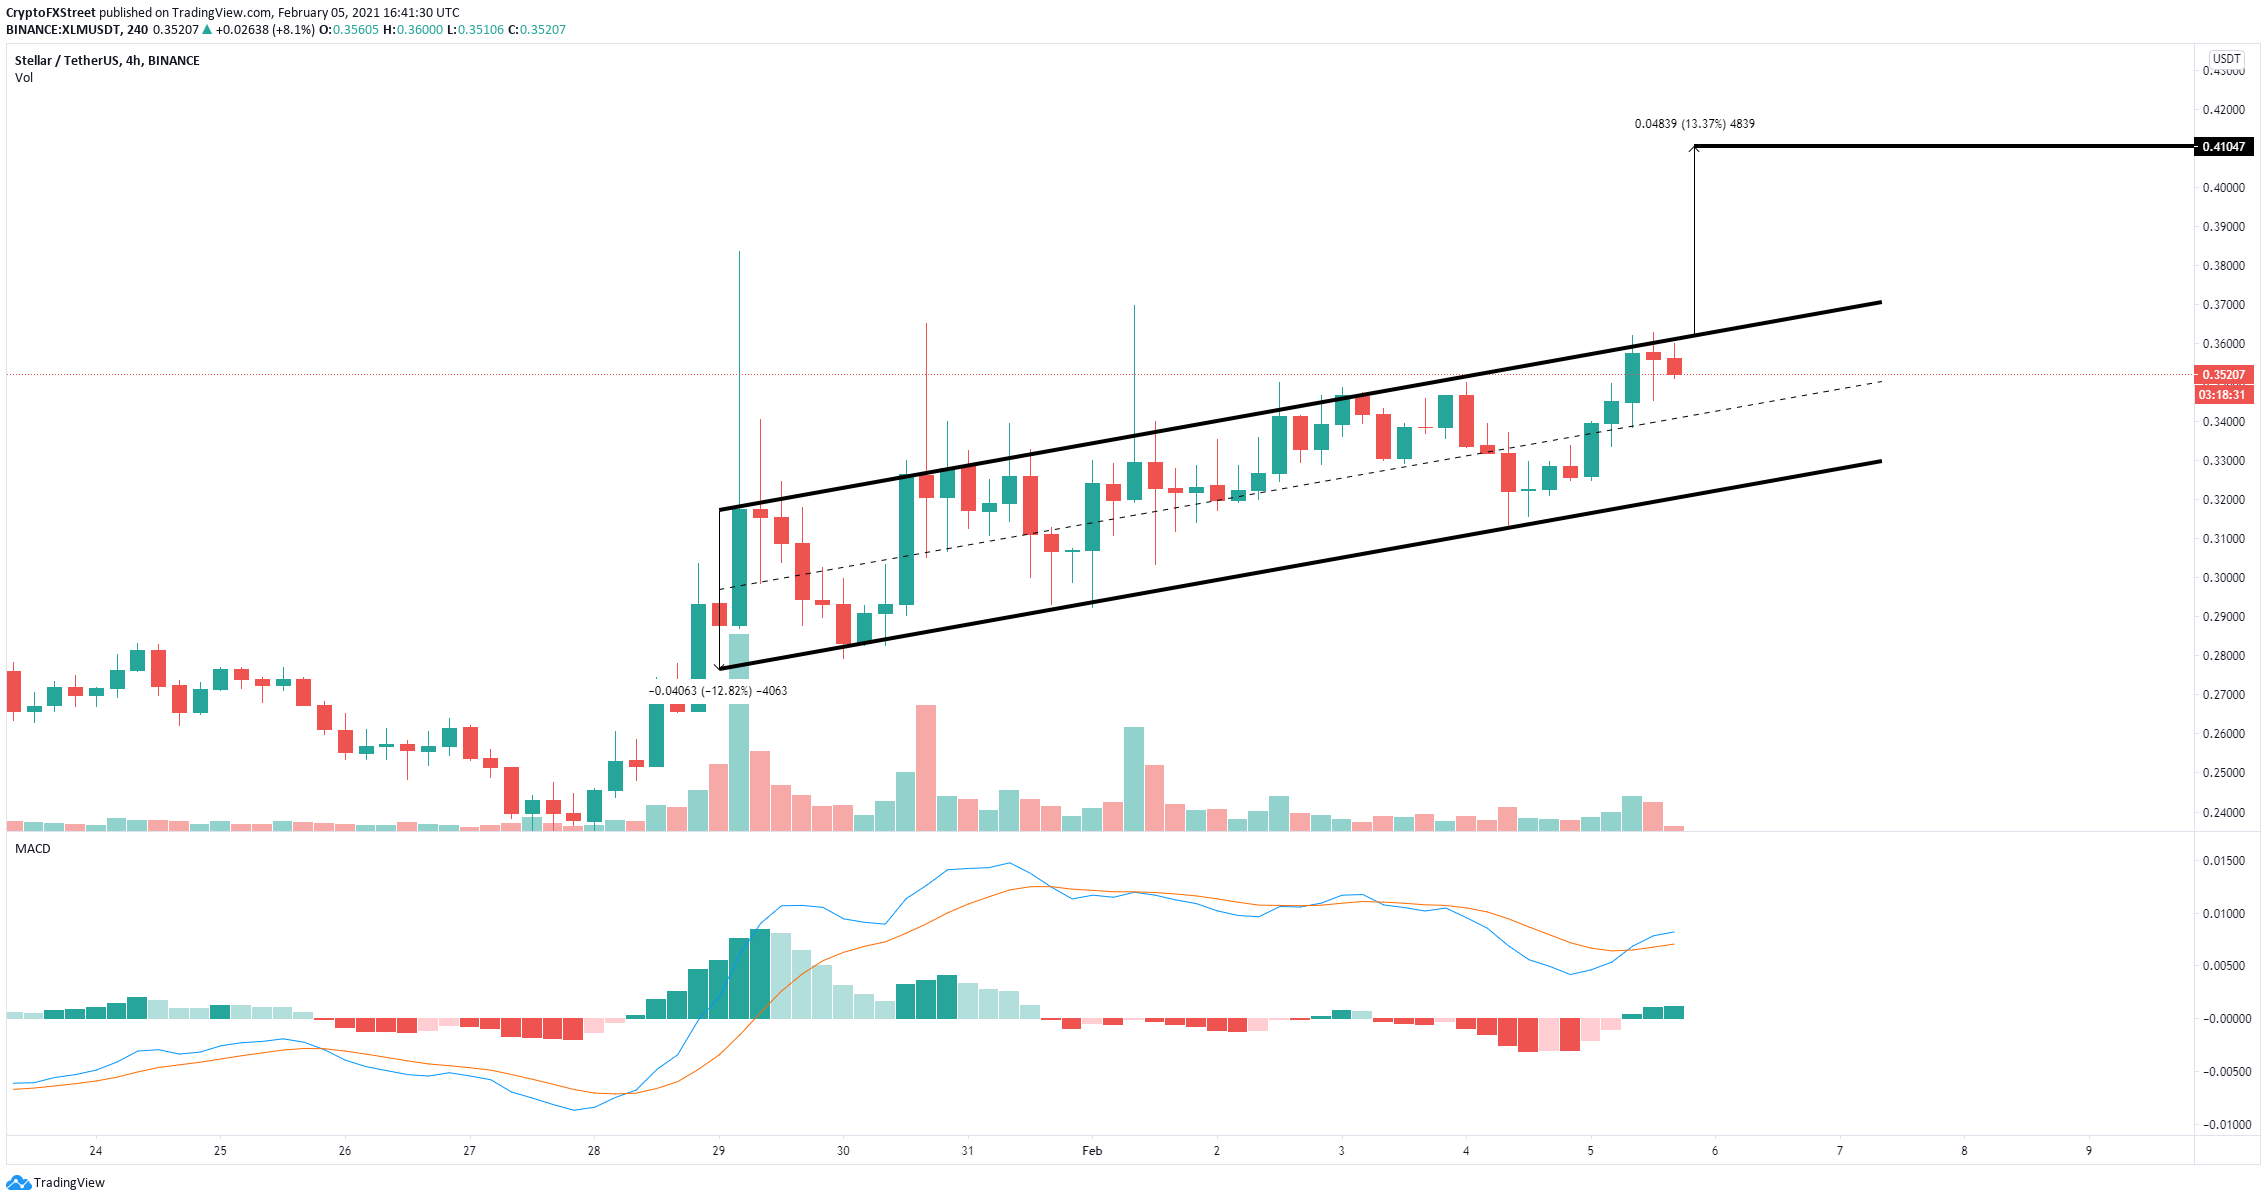
XLM/USD 4-hour chart

Additionally, the MACD flipped bullishly again strongly for the first time since January 28 which managed to push XLM by more than 50%. This adds more credence to the bullish outlook described above. 
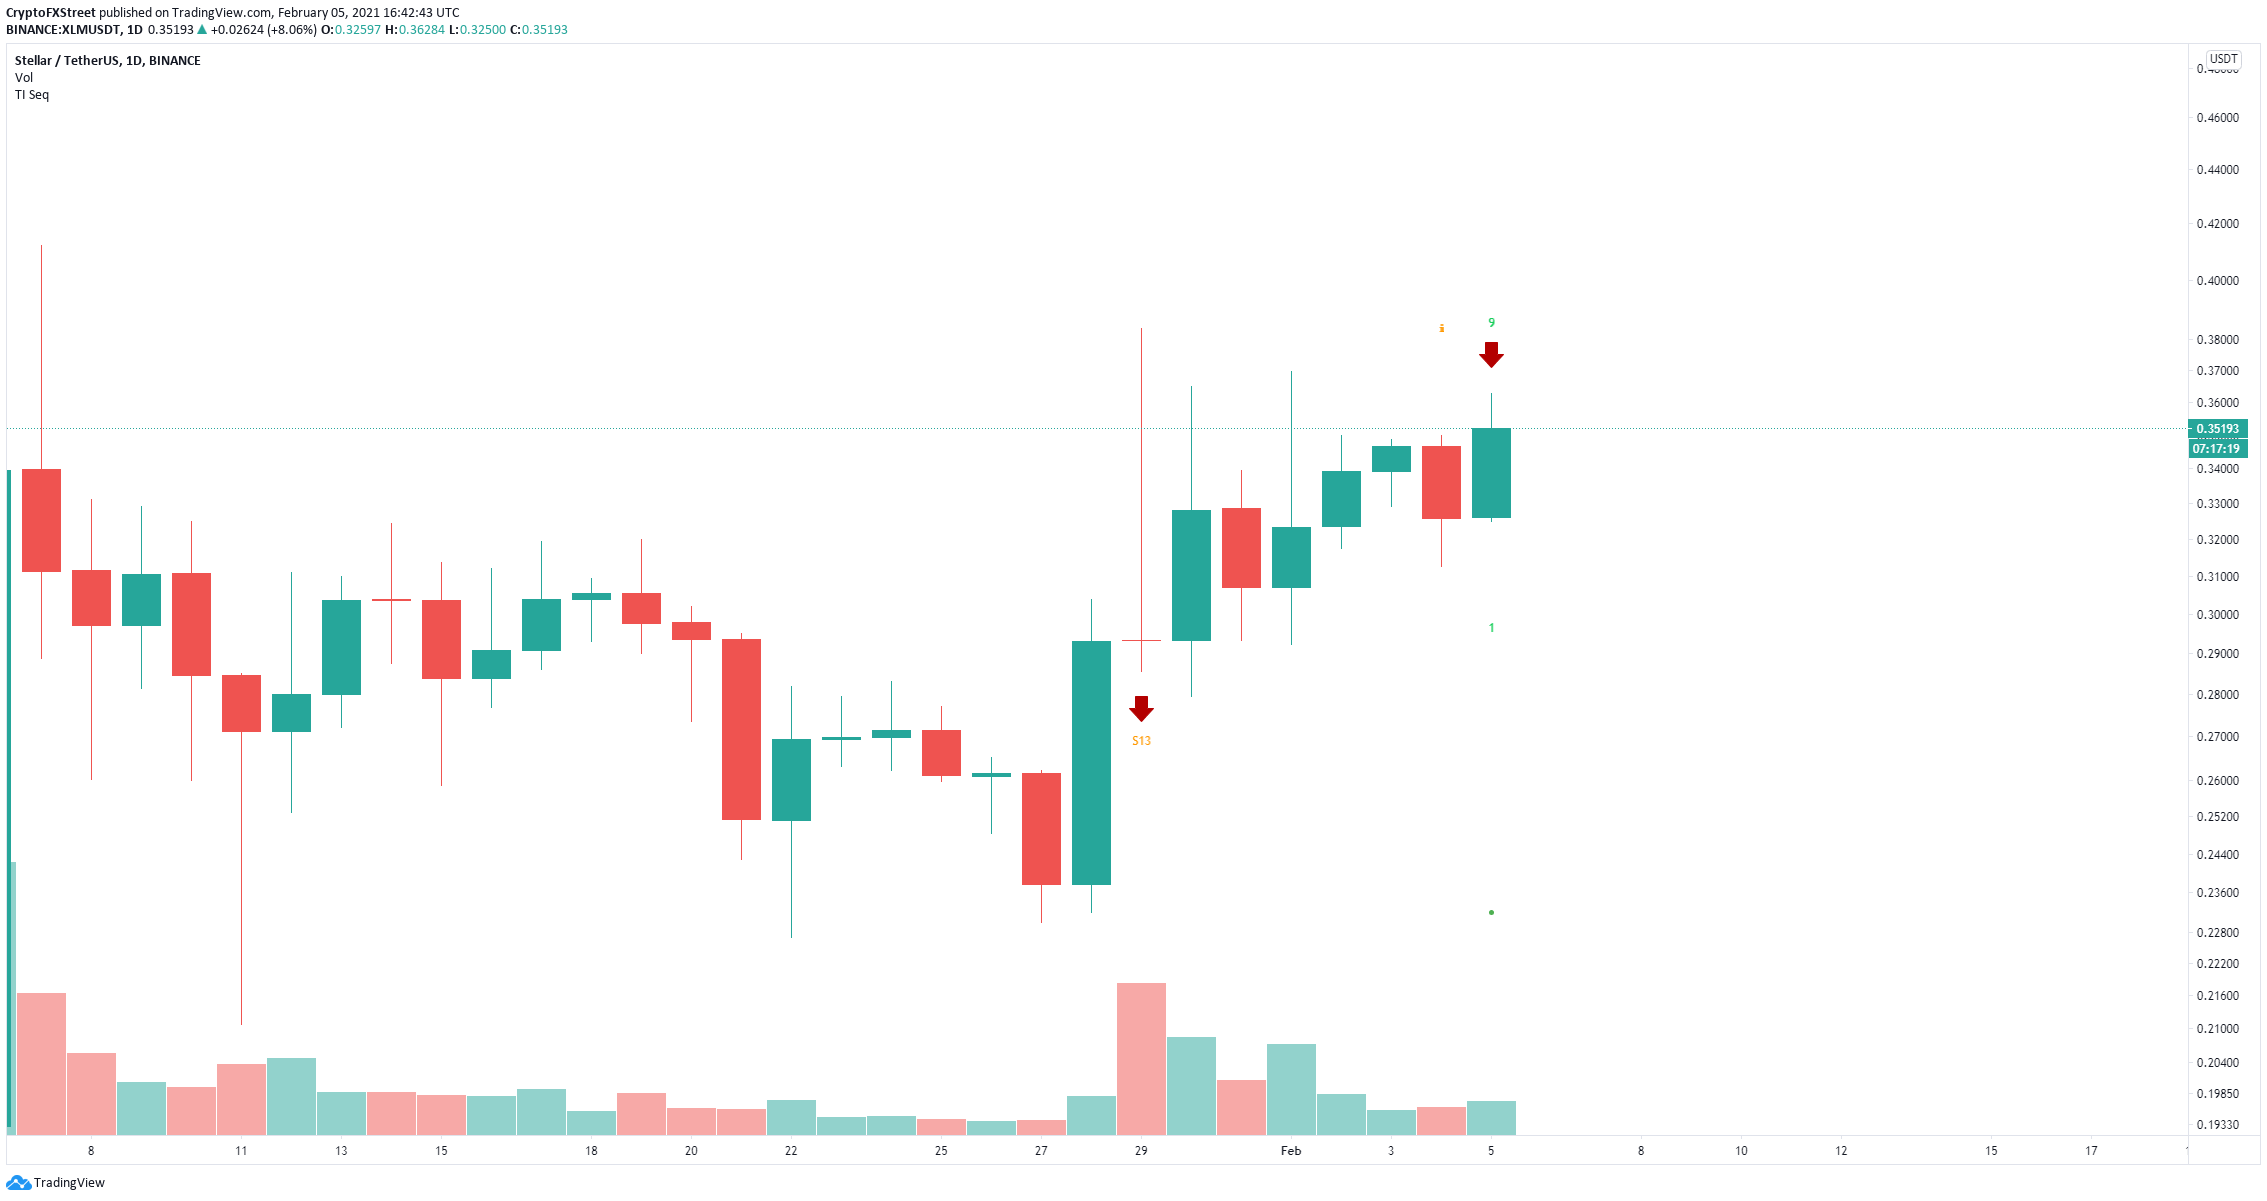
xlm price

XLM/USD daily chart

However, on the daily chart, the TD Sequential indicator has just presented a sell signal for the first time since November 24, 2020. Validation of this call can drive Stellar price towards the psychological level at $0.30 for a retest.

Author

Lorenzo Stroe

Lorenzo Stroe

Independent Analyst

Lorenzo is an experienced Technical Analyst and Content Writer who has been working in the cryptocurrency industry since 2012. He also has a passion for trading.

More from Lorenzo Stroe
Share:

Editor's Picks

Ripple ticks up as buyers re-engage

Ripple trends higher at the time of writing on Thursday, trading above $1.12. The cross-border remittance token seeks to erase a persistent downtrend that has weighed on the price since mid-May, as investors navigated geopolitical tensions in the Middle East.

Crypto Today: Bitcoin, Ethereum, XRP rebound broadens despite continued US-Iran strikes

Bitcoin steadies its recovery on Thursday, edging higher toward $63,000 despite incessant capital outflows. Meanwhile, altcoins, including Ethereum and Ripple, exhibit subtle rebound signs, trading above $1,650 and $1.12, respectively.

Bitcoin stages modest rebound ahead of US PPI data

Bitcoin recovers slightly, trading above $62,500 on Thursday after three consecutive days of losses. US-listed spot ETFs recorded outflows of $213.85 million on Wednesday, indicating persistent withdrawals amid renewed US-Iran tensions.

Pi Network: Recovery at risk with 16 million PI tokens ready for unlock

Pi Network edges higher on Thursday after three days of consecutive losses earlier this week, extending the prevailing downtrend since late April. The scheduled unlocking of 16 million PI tokens on Thursday could add pressure to the intraday recovery.

Bitcoin: After the bloodbath, everyone looks at $60,000
Bitcoin (BTC) hovers above $62,000 at the time of writing on Friday, weighed down by growing risk-off sentiment due to persistent geopolitical tensions in the Middle East and sticky macroeconomic uncertainty. The institutional sell-off continued to wreak havoc on capital flows, with spot Bitcoin Exchange-Traded Funds (ETFs) recording billions in outflows.