XLM price needs to overcome big hurdles before Stellar can race to a 30% gain
- XLM price action is locked below the 50-week simple moving average (SMA) at $0.282.
- Stellar fails to build on gains inspired by rumors of a bid for MoneyGram, an international remittance service.
- The Anchored VWAP from March 13, 2020, at $0.305 will present another formidable point of resistance.

XLM price has rallied 35.23% since July 20, highlighted by a 15.47% gain on July 22 and underpinned by rumors of a Stellar bid for MoneyGram. However, since the July 22 burst higher, the cryptocurrency is up only 8.44%, marking a negative divergence with some prominent altcoins and Bitcoin. Stellar is not an actionable opportunity as long as it trades below the 50-week SMA and Anchored VWAP from March 13, 2020.
XLM price still searches for a sustainable bid
XLM price briefly traded above the 50-week SMA last week before finally closing up 5.07% and ending July with a gain of 0.11%. The intra-month low came close to the 78.6% Fibonacci retracement of the 2020-2021 advance at $0.191, and the 200-week SMA at $0.185, representing a full trend reset for Stellar.
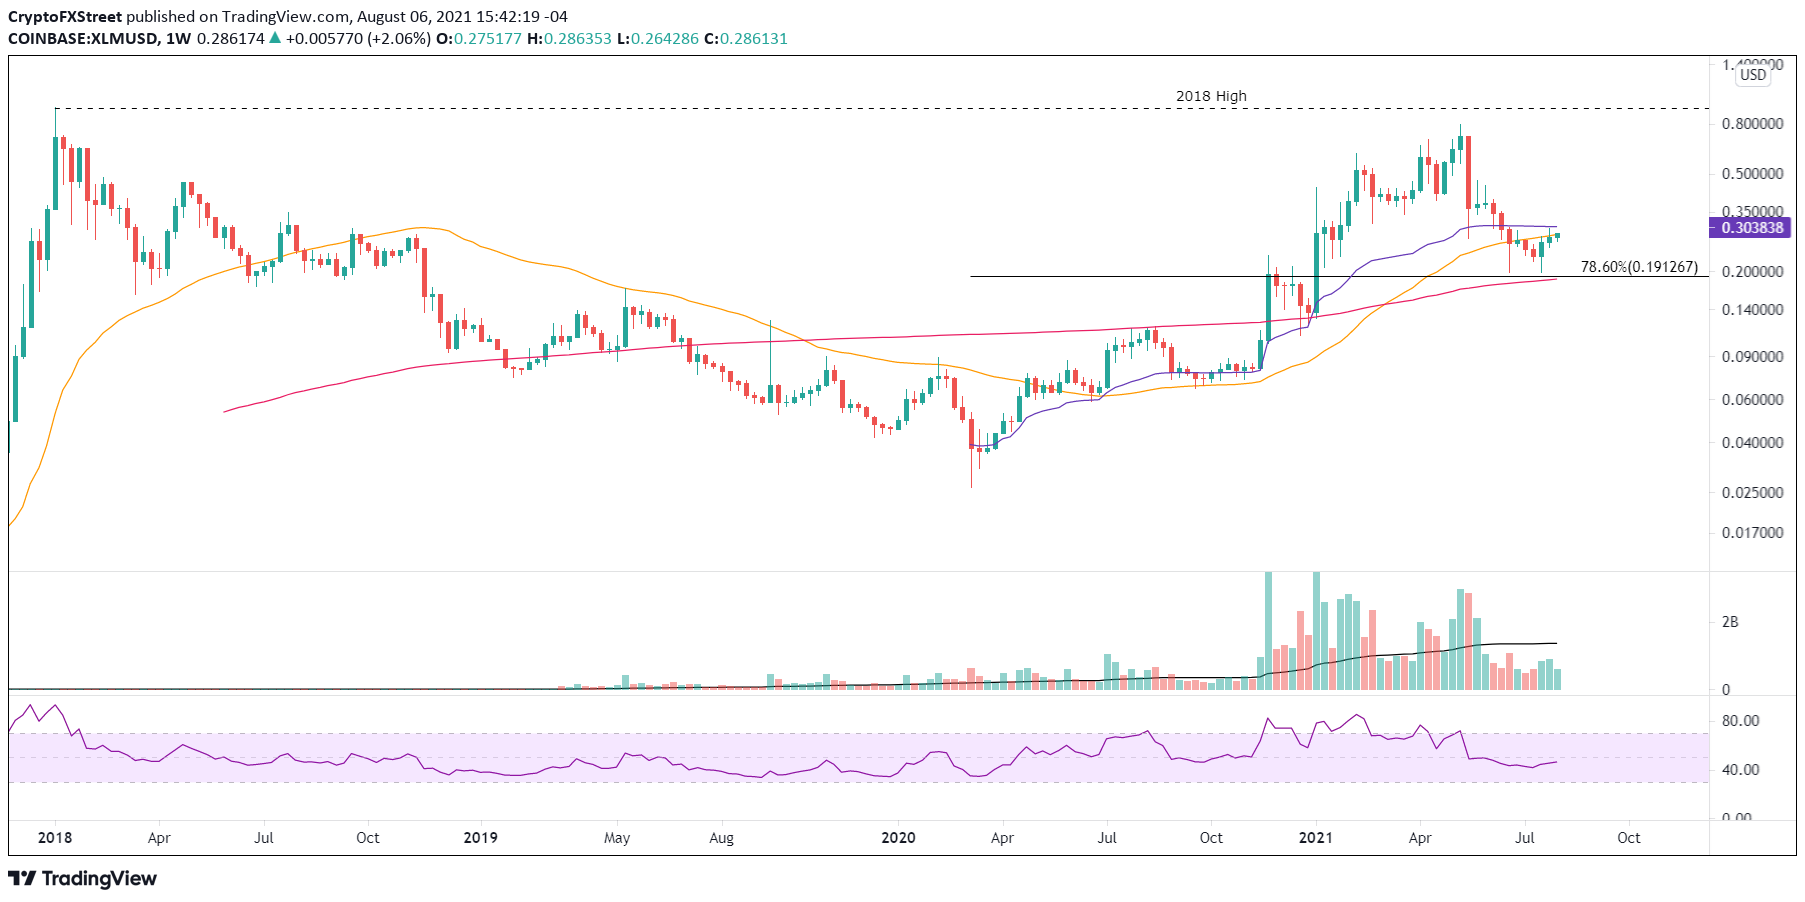
XLM/USD weekly chart
Currently, XLM price is locked below the confluence of the 50-week SMA at $0.282 with the apex of a symmetrical triangle formed in June-July at $0.277. As a result, Stellar has printed three doji candlestick patterns over the last four sessions, underscoring the indecision and uncertainty among market speculators, despite the potential bid for MoneyGram.
Moving forward, XLM price needs to register a daily close above the $0.277-$0.282 range and above the Anchored VWAP at $0.305 before a bullish outlook can be confirmed. It would put Stellar in a comfortable position to rally to the 200-day SMA at $0.396, equating to a 30% gain from the Anchored VWAP.
XLM price may briefly stumble at the apex of another symmetrical triangle from May-June at $0.342, but it does not coincide with a technical indicator, diminishing the importance.
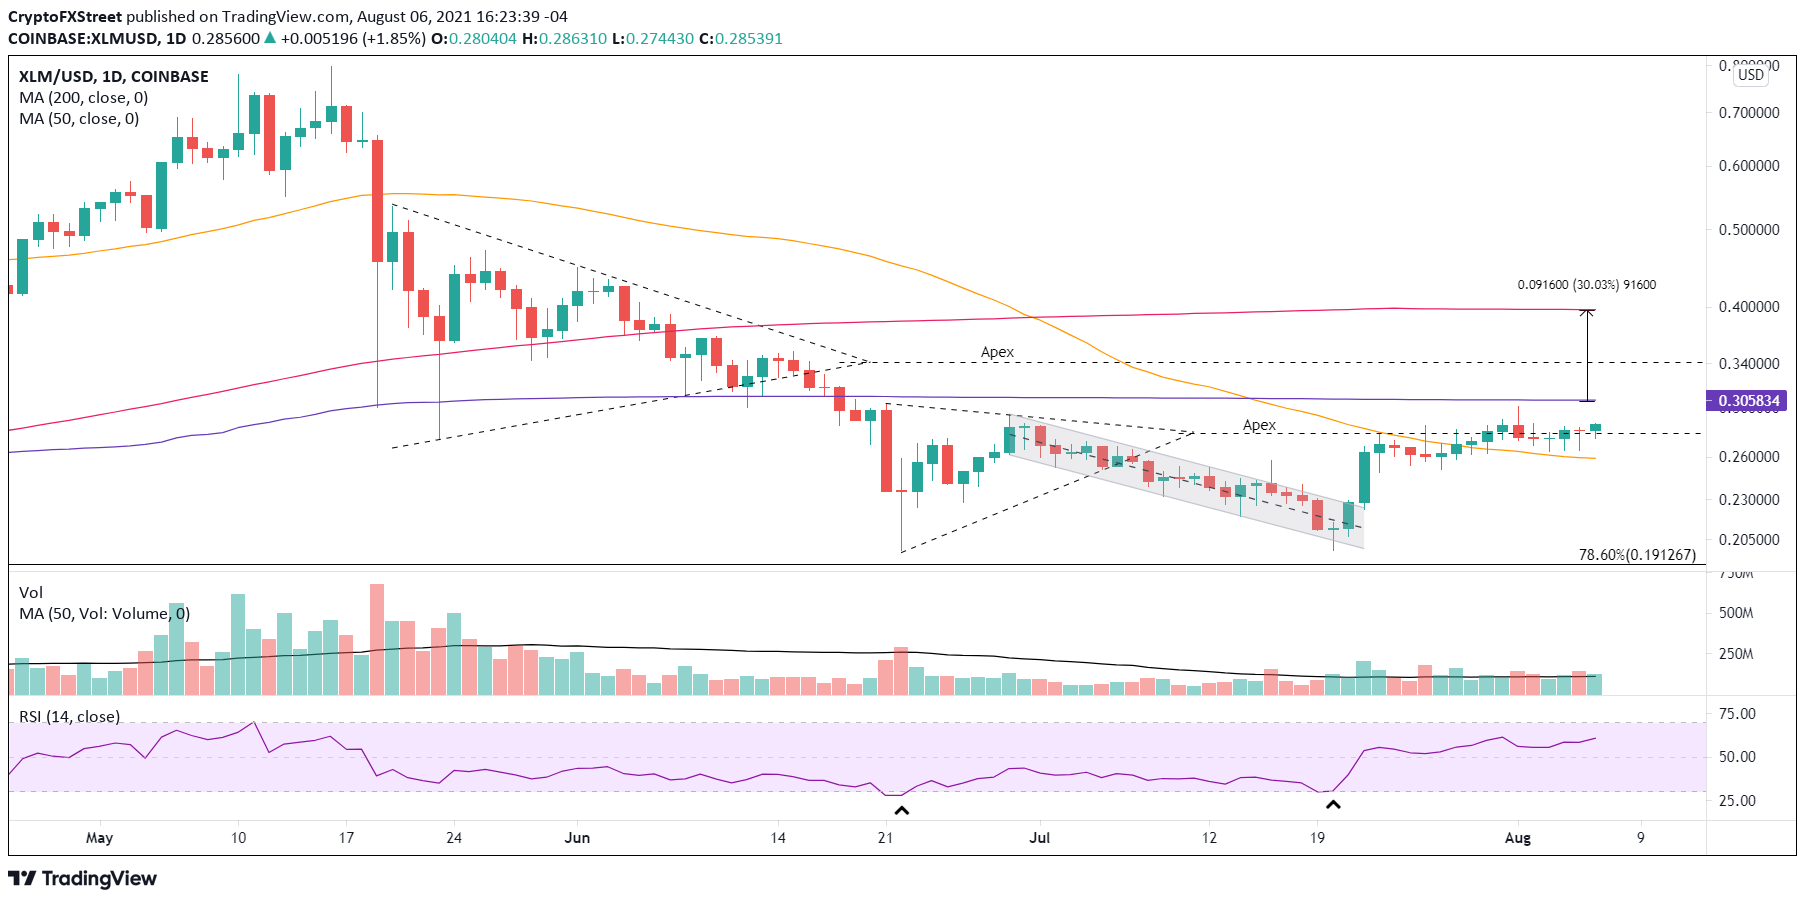
XLM/USD daily chart
If XLM price is to bust the above resistance levels, it must hold the 50-day SMA at $0.258 if selling emerges. A daily close below puts Stellar in a vulnerable position and raises the probability it will retrace the entire advance from the May 20 low of $0.199.
The rumors of a MoneyGram bid on July 22 did break XLM price from a descending parallel channel. Still, it did not generate a sustainable bid, proving the importance of the apex of the June-July symmetrical triangle and the strategically important 50-week SMA as resistance. Without confirmation of the rumors, Stellar may be doomed to the sideways action moving forward.
Author

Sheldon McIntyre, CMT
Independent Analyst
Sheldon has 24 years of investment experience holding various positions in companies based in the United States and Chile. His core competencies include BRIC and G-10 equity markets, swing and position trading and technical analysis.


