XLM Price Prediction: Stellar faces technical challenges, upside limited
- XLM price is stumbling with the resistance defined by the 50-day simple moving average (SMA) and symmetrical triangle apex.
- Stellar is almost flat for the month after being down 30% on July 20.
- Social media volume gets a brief boost on the Moneygram speculation, but nothing sustainable.

XLM price has climbed over 40% since the July 20 low, shredding the trading range defined by the descending parallel channel since the end of June. The rise has taken Stellar to a trifecta of resistance around $0.278, but enthusiasm behind a potential Moneygram deal is proving to be insufficient in busting the resistance. Until more concrete news emerges on the Moneygram discussions, XLM price could be flipped into a mild correction, releasing the price congestion generated by the rapid ascent.
XLM price needs to shake the chains of resistance before bolder outlooks can emerge
Since the 15.47% gain on July 22, inspired by speculation that the Stellar Development Foundation (SDF) was in talks to acquire Moneygram, XLM price has shown minimal follow-through with a 4.30% gain over the last four days. It is not the type of follow-through that should accompany a deal that could position Stellar for a global audience.
Amid the speculation, it is easy to overlook the importance of the price structure and the resulting indicators and levels. For example, XLM price tagged the symmetrical triangle apex at $0.278 and the 50-day SMA at $0.279 on July 23 but was quickly rejected. Today, Stellar is stalling at the two levels, this time reinforced by the 50-week SMA at $0.278. Moreover, the May crash low is $0.274, further strengthening the resistance.
To shed the imposing resistance, XLM price needs a daily close above the June 29 high of $0.293. However, Stellar will be challenged by another striking level of resistance at $0.300. It marks the May 19 low, and it was influential on XLM price in June. If the digital asset pushes through the levels, it will encounter resistance at the previous symmetrical triangle's apex at $0.341, logging a 13% gain from the May 19 low of $0.300.
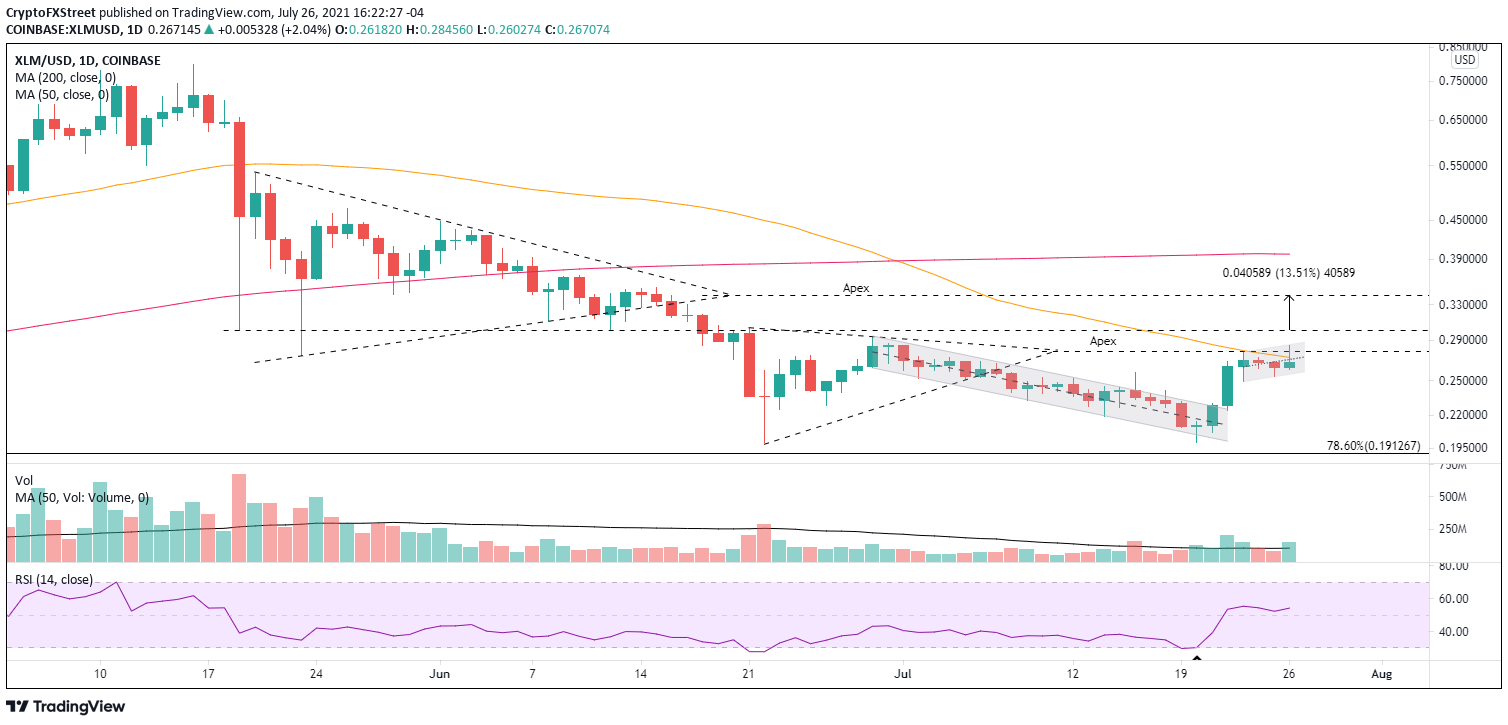
XLM/USD daily chart
If the XLM price advance is sustainable, Stellar should not correct beyond $0.242, or it would warn of a deeper decline and a potential test of the July 20 low of $0.199.
The big speculation about a Moneygram takeover did cause a brief jump in social media activity. Still, the Santiment Social Volume metric has fallen back into the prior range, and the 30 eight-hour simple moving average (SMA) remains essentially unchanged.
Additionally, based on the 30 eight-hour SMA peaks, the long-term trend in social media activity remains in a downtrend, highlighting a general lack of interest among the ranks of retail investors.
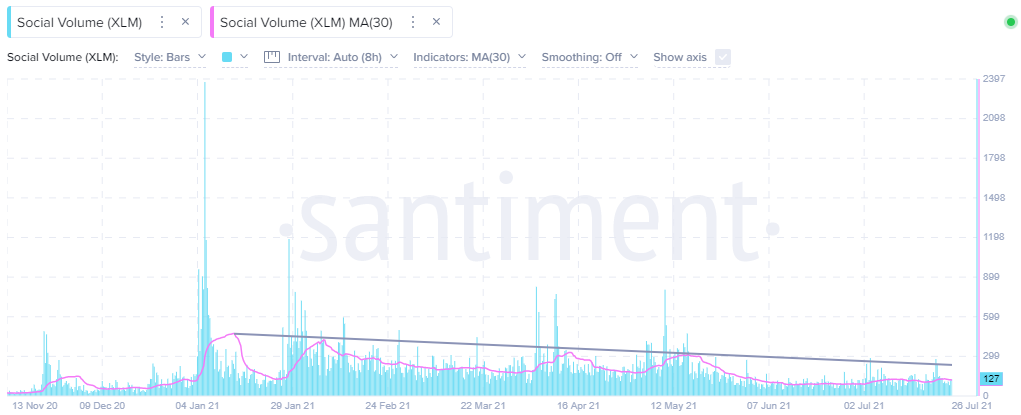
XLM Social Volume - Santiment
There is no disconnect between price and social media volume. Each popped on the Moneygram news, but the XLM price euphoria has dissipated, bending to the chart technicals. Meanwhile, social media volume has returned to the prior range, showing no enduring enthusiasm.
Author

Sheldon McIntyre, CMT
Independent Analyst
Sheldon has 24 years of investment experience holding various positions in companies based in the United States and Chile. His core competencies include BRIC and G-10 equity markets, swing and position trading and technical analysis.


