XLM price fades as Stellar briefly strikes an all-time high
- XLM price fails above topside trend line resistance, leaving potential for a bearish candlestick pattern.
- Daily Relative Strength Index (RSI) conveys a negative momentum divergence today.
- Historical precedent suggests that social sentiment may be forecasting a short-term high.

XLM price has staggered higher, beginning in April with a marginal new high, then today’s brief spike into new highs. The failure of XLM price above the topside trend line resistance and the 461.8% Fibonacci extension of the 2019-2020 bear market should put traders on the defensive.
XLM price today suggests sellers are in command
Stellar has been a reluctant participant in the cryptocurrency rally of 2021, achieving modest gains following the multiple breakouts of this year. The unfolding breakout today is beginning to appear like another brief new high.
The XLM price failure today has retraced half of the intra-day gains, and if the selling continues, it will create a bearish shooting star candlestick pattern on the daily chart. The candlestick’s real body should not be more than one-third of the entire candlestick range, and the lower shadow should be non-existent or minor. Additionally, the longer the upper shadow, the greater the bearishness.
The shooting star pattern highlights how buyers are struggling to lift prices higher. Still, they are eventually overpowered by the sellers, who successfully push prices lower and into the bottom range of the candlestick. It signifies that bearish traders have seized control of the price direction.
At the time of writing, XLM price is not set to close with a shooting star pattern, but bearish speculators should be watching into the daily close. The pattern would confirm a bearish outlook for the cryptocurrency and raise the odds of a correction.
To further add to the heightened level of concern, the daily RSI’s failure to match the price with a new high continues the bearish momentum divergence that began in April.
Downside support begins at $0.576, followed by the minor rising trend line at $0.556 and then the 361.8% extension of the 2019-2020 bear market at $0.546.
More weakness will discover support at the 50-day simple moving average (SMA) at $0.506.
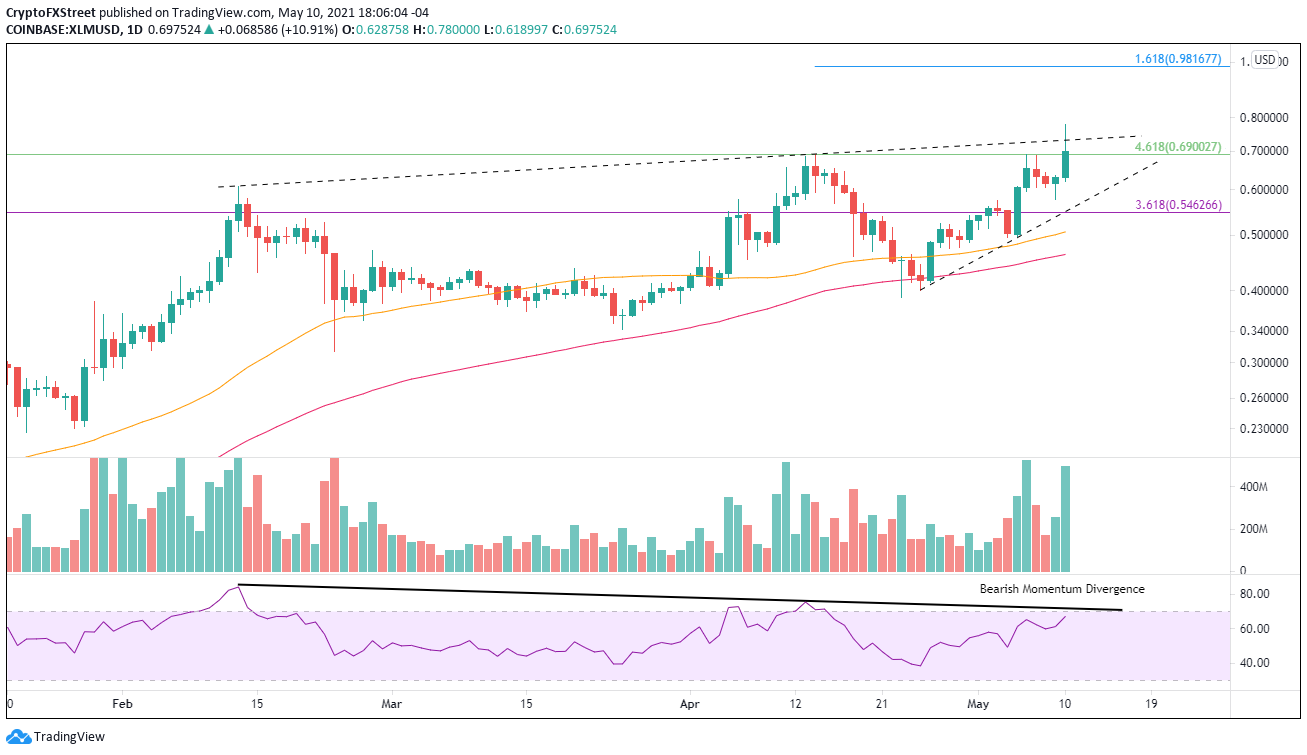
XLM/USD daily chart
A general rebound for the broader crypto market may permit XLM price to gain traction and help it avoid the bearish shooting star alternative. The only upside target of note is the convergence of the 161.8 extension of the April decline at $0.981 with the psychologically important $1.00.
According to the data from over 1000 crypto-related channels, including Telegram groups, crypto reddits, discord groups, and private trader chats, Stellar’s daily social volume has spiked today to the highest level since the end of January. The increase in XLM mentions illustrates that retail speculators are closely following even this marginal new high.
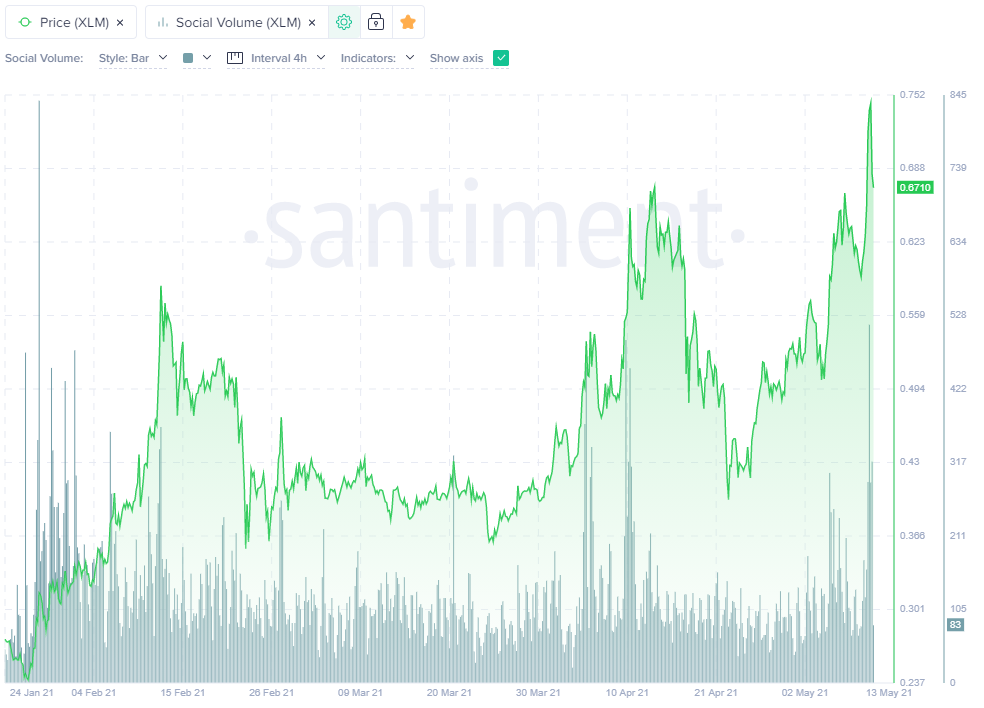
XLM related mentions on social media
Greater social interest often accompanies price highs, sometimes significant and other times minor. Either way, it adds to the caution and should be kept in mind when entering and exiting trades as changes in sentiment can often have adverse effects on a digital asset’s price action.
Author

Sheldon McIntyre, CMT
Independent Analyst
Sheldon has 24 years of investment experience holding various positions in companies based in the United States and Chile. His core competencies include BRIC and G-10 equity markets, swing and position trading and technical analysis.


