XLM price building base for bullish breakout
- Stellar bulls are in the last phase of completing a bullish triangle.
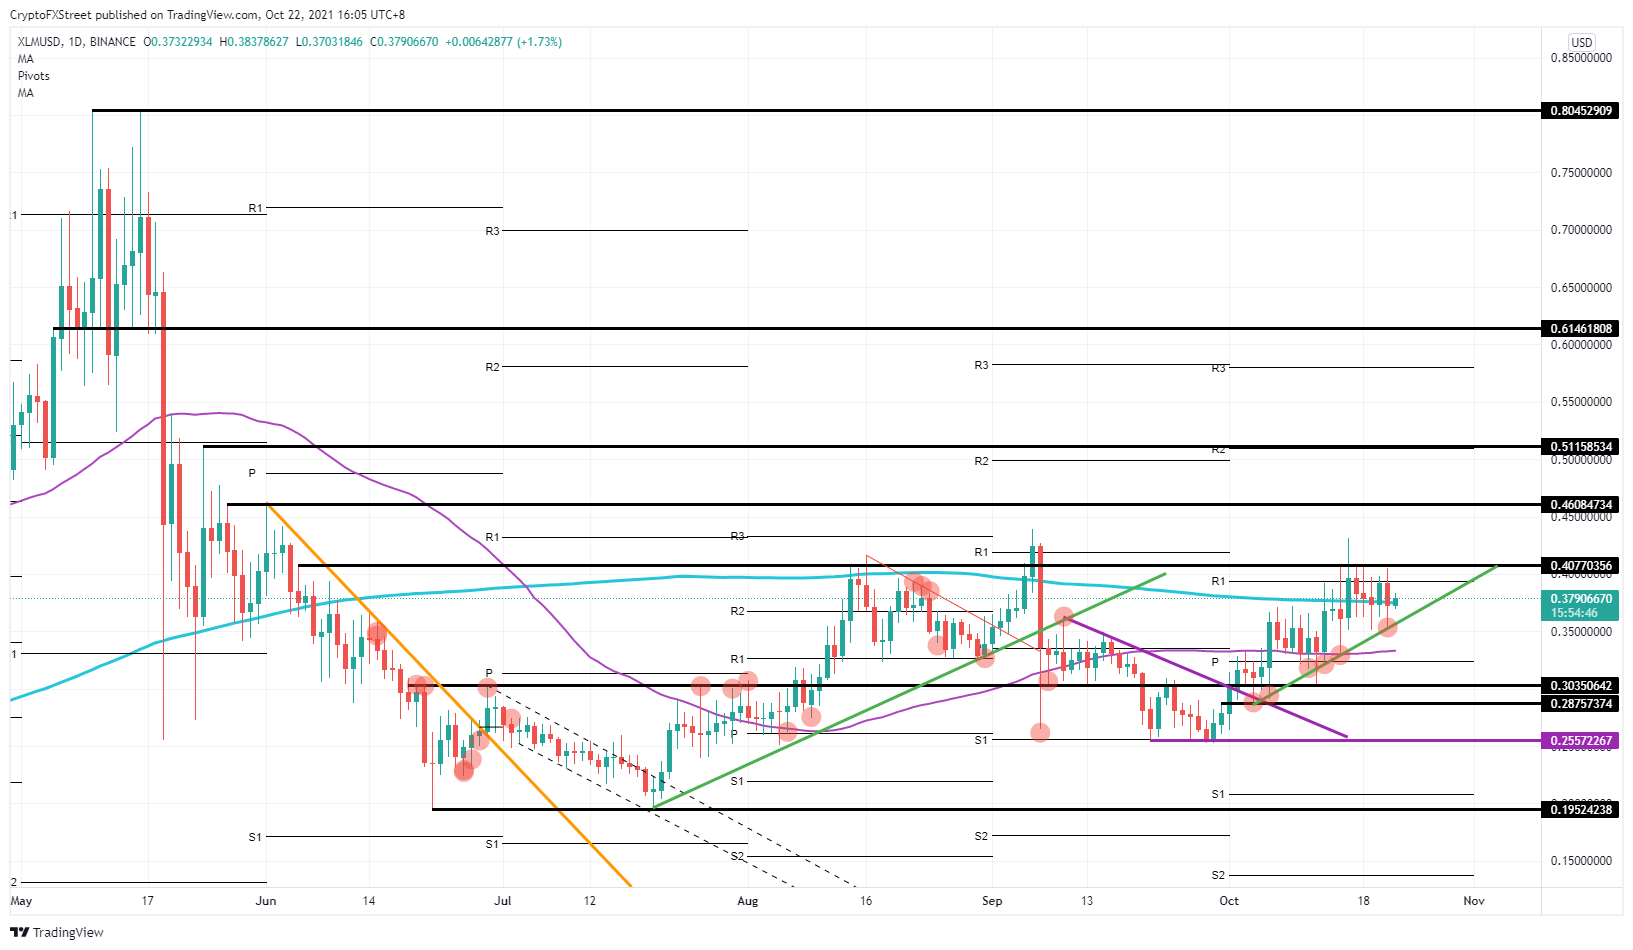
- As XLM price is getting squeezed against the base ($0.40), expect a quick breakout of 12%.
- After taking a breather, expect another 10% of profits to follow.

Stellar (XLM) is still respecting the bullish triangle where lower highs are playing out, and on the topside, the price is getting squashed up against $0.40 resistance level each time it meets it. With momentum building, a quick pop through the top could happen with XLM price moving quickly towards $0.46. Although some profit-taking could slow momentum early on, expect the rally to have legs, and probably head towards $0.51.
XLM price rally holds more potential
XLM price has been respecting the bullish triangle that formed in October for quite a few weeks now – excepting one false breakout. Bulls flocked in massively on October 15, at the level of the 55-day Simple Moving Average (SMA) where it crossed the green ascending trend line.
The shelf of resistance at $0.40 has kept price action muted for quite some time now. A few false breakouts were each time quickly reversed by bears defending this level since June 05. But with higher lows and XLM price being squeezed against $0.40, an outbreak looks imminent.
XLM/USD daily chart
XLM price may see more bulls flocking in for a quick pop higher above $0.40. Expect some quick profit-taking at $0.46. From there, XLM price will probably correct back to $0.40 where it will test that level for support.
XLM price will probably then bounce off $0.40 under new entries of fresh buying volume, that will see the price ramp up towards $0.51. At that level the rally will probably stall, as $0.51 falls in line with the monthly R2 resistance level and historical high from May 24. At that point, XLM will probably make a pattern like the previous outbreak and will fade back to $0.46 for a support test before reattempting to break $0.51.
Should bulls fail to break $0.40, expect bears to push price-action back down, or let bulls enter into a bull trap before bears run price back down. A green ascending trend line break will push XLM price back to $0.30 and $0.25.
Author

Filip Lagaart
FXStreet
Filip Lagaart is a former sales/trader with over 15 years of financial markets expertise under its belt.


