|

XLM Price Forecast: Stellar primed for a 30% breakout

  • Stellar price moves closer to a breakout from a symmetrical triangle pattern.
  • A 30% upswing in XLM can be expected after a decisive close above the $0.43 level.
  • The Bollinger bands show that a close outside of the no-trade zone ranging from $0.38 to $0.43 will improve XLM’s volatility.

XLM has been stagnant for over the past two weeks, but volatility is about to strike back.

XLM price prepares to breakout

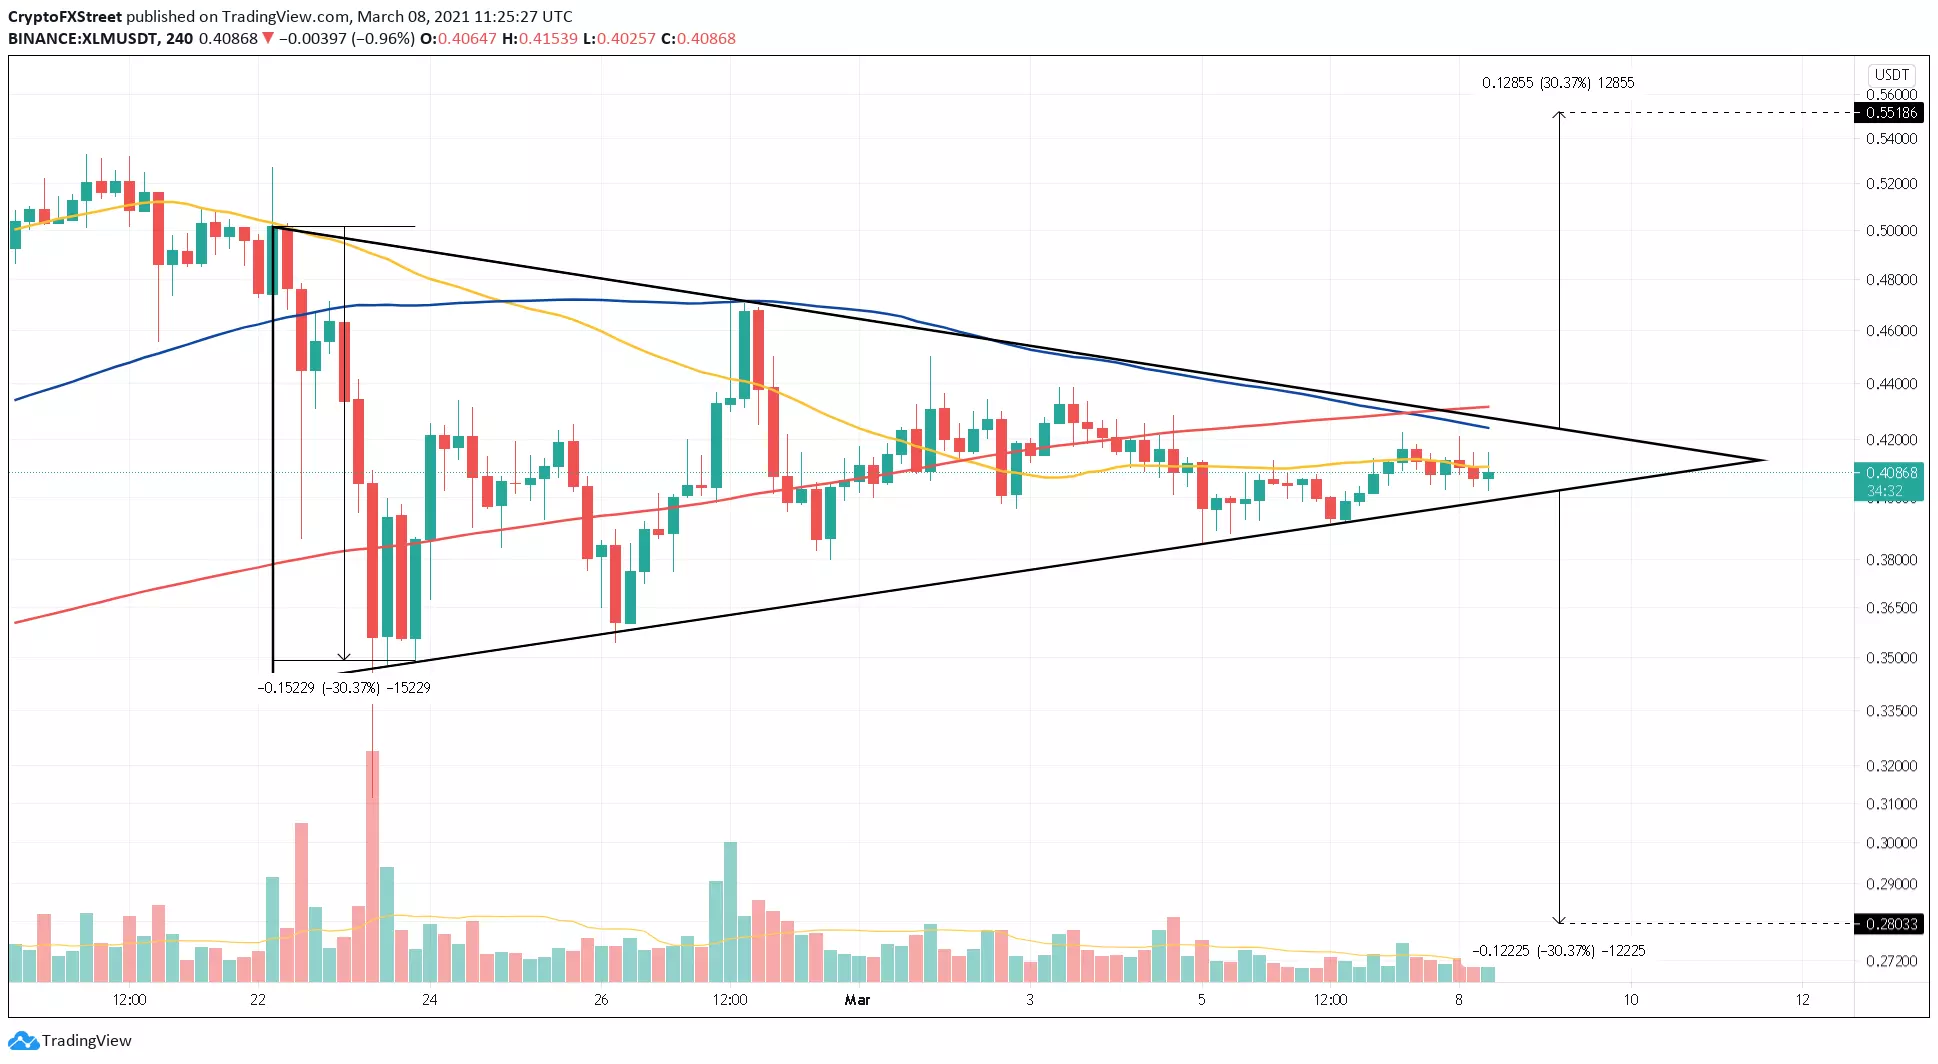
Aggressive buyers and sellers have caused Stellar to form a series of lower highs and higher lows. By connecting these pivot points using trendlines, it seems like XLM price developed a symmetrical triangle pattern on its 4-hour chart. 

This consolidation pattern forecasts that Stellar is primed for a 30% price movement as the asset trudges closer towards the triangle’s apex. But its inability to determine the direction of the trend, suggests that the $0.43 to $0.40 range is a reasonable no-trade zone. 

A 4-hour candlestick close above this price pocket could lead to an upswing to $0.55, but a decisive close below it will trigger a sell-off to $0.28.
XLM/USDT 4-hour chart

XLM/USDT 4-hour chart

It is worth noting that the 50, 100, and 200 four-hour moving averages are currently hovering above XLM price. Therefore, the confluence of these trend-following indicators could deter any short-term bullish momentum. 

XLM must breach the supply barrier posed by these indicators to see any substantial growth because failing to do so will be catastrophic for the bulls.

Author

Akash Girimath

Akash Girimath is a Mechanical Engineer interested in the chaos of the financial markets. Trying to make sense of this convoluted yet fascinating space, he switched his engineering job to become a crypto reporter and analyst.


More from Akash Girimath
Share:

Editor's Picks

Zcash Price Forecast: ZEC declines as US inflation surprise offsets fresh ETF inflows

Zcash is trading in the red, extending its previous day’s roughly 6% losses as the broader cryptocurrency market falls on rising US inflation. The US Consumer Price Index print came in higher than expected, at an annual increase of 3.7% versus the expected 3.6%, raising concerns about inflation and rate hikes.

Ripple and Stellar outlook: XRP and XLM extend losses as US inflation data weighs in

Ripple and Stellar extend their losses on Thursday as bearish momentum builds, having corrected over 7% and 11% so far this week. XRP and XLM both slip below key support zones, indicating weakening technical structure.

Bitcoin falls on hot CPI: Why $80,000 support matters

Bitcoin's most critical level to watch is near $80,000 as September's hot inflation reading pressures the crypto market, according to Glassnode. The top crypto declined within minutes of the September CPI release, which showed a 3.7% annual increase in headline inflation, above forecasts of 3.6%. Core inflation, which excludes food and energy prices, came in at 2.6%.

Ethereum Price Forecast: ETH falls below $2,500 as hot CPI raises Fed hike odds
Ethereum (ETH) extended its decline below $2,500 on Wednesday after a hotter-than-expected US inflation print renewed selling across the crypto market. At the time of writing, the top altcoin trades near $2,430, down 3.1% in the past 24 hours. The US Consumer Price Index (CPI) for September rose 0.6% monthly, in line with market forecasts and up from a 0.4% increase in August.
Bitcoin: Uptober or Rektober?
Bitcoin (BTC) price is down over 4% so far this week, trading below $83,000 at the time of writing on Friday as mounting selling pressure threatens to derail the seasonal “Uptober” rally. Profit-taking, a surge in long liquidations and weakening demand from institutional investors are weighing on BTC.


