Stellar Price Forecast: XLM recent breakout could be stopped short according to key indicator
- Stellar price had a significant breakout from a symmetrical triangle pattern.
- The digital asset aims for a 34% move towards $0.55.
- However, a key indicator is close to presenting two robust sell signals on different time frames.

Stellar was trading inside a tightening range since February 21 before finally seeing a breakout above the upper resistance trendline. However, the move was fairly weak and a key indicator shows XLM could be facing strong selling pressure.
Stellar price aims for $0.55 but might have to endure some pain first
On the 4-hour chart, the breakout from the symmetrical triangle pattern has a price target of $0.55, a 34% move calculated using the height of the pattern. Initially, XLM didn’t see a lot of continuation after the breakout but has finally touched $0.434.
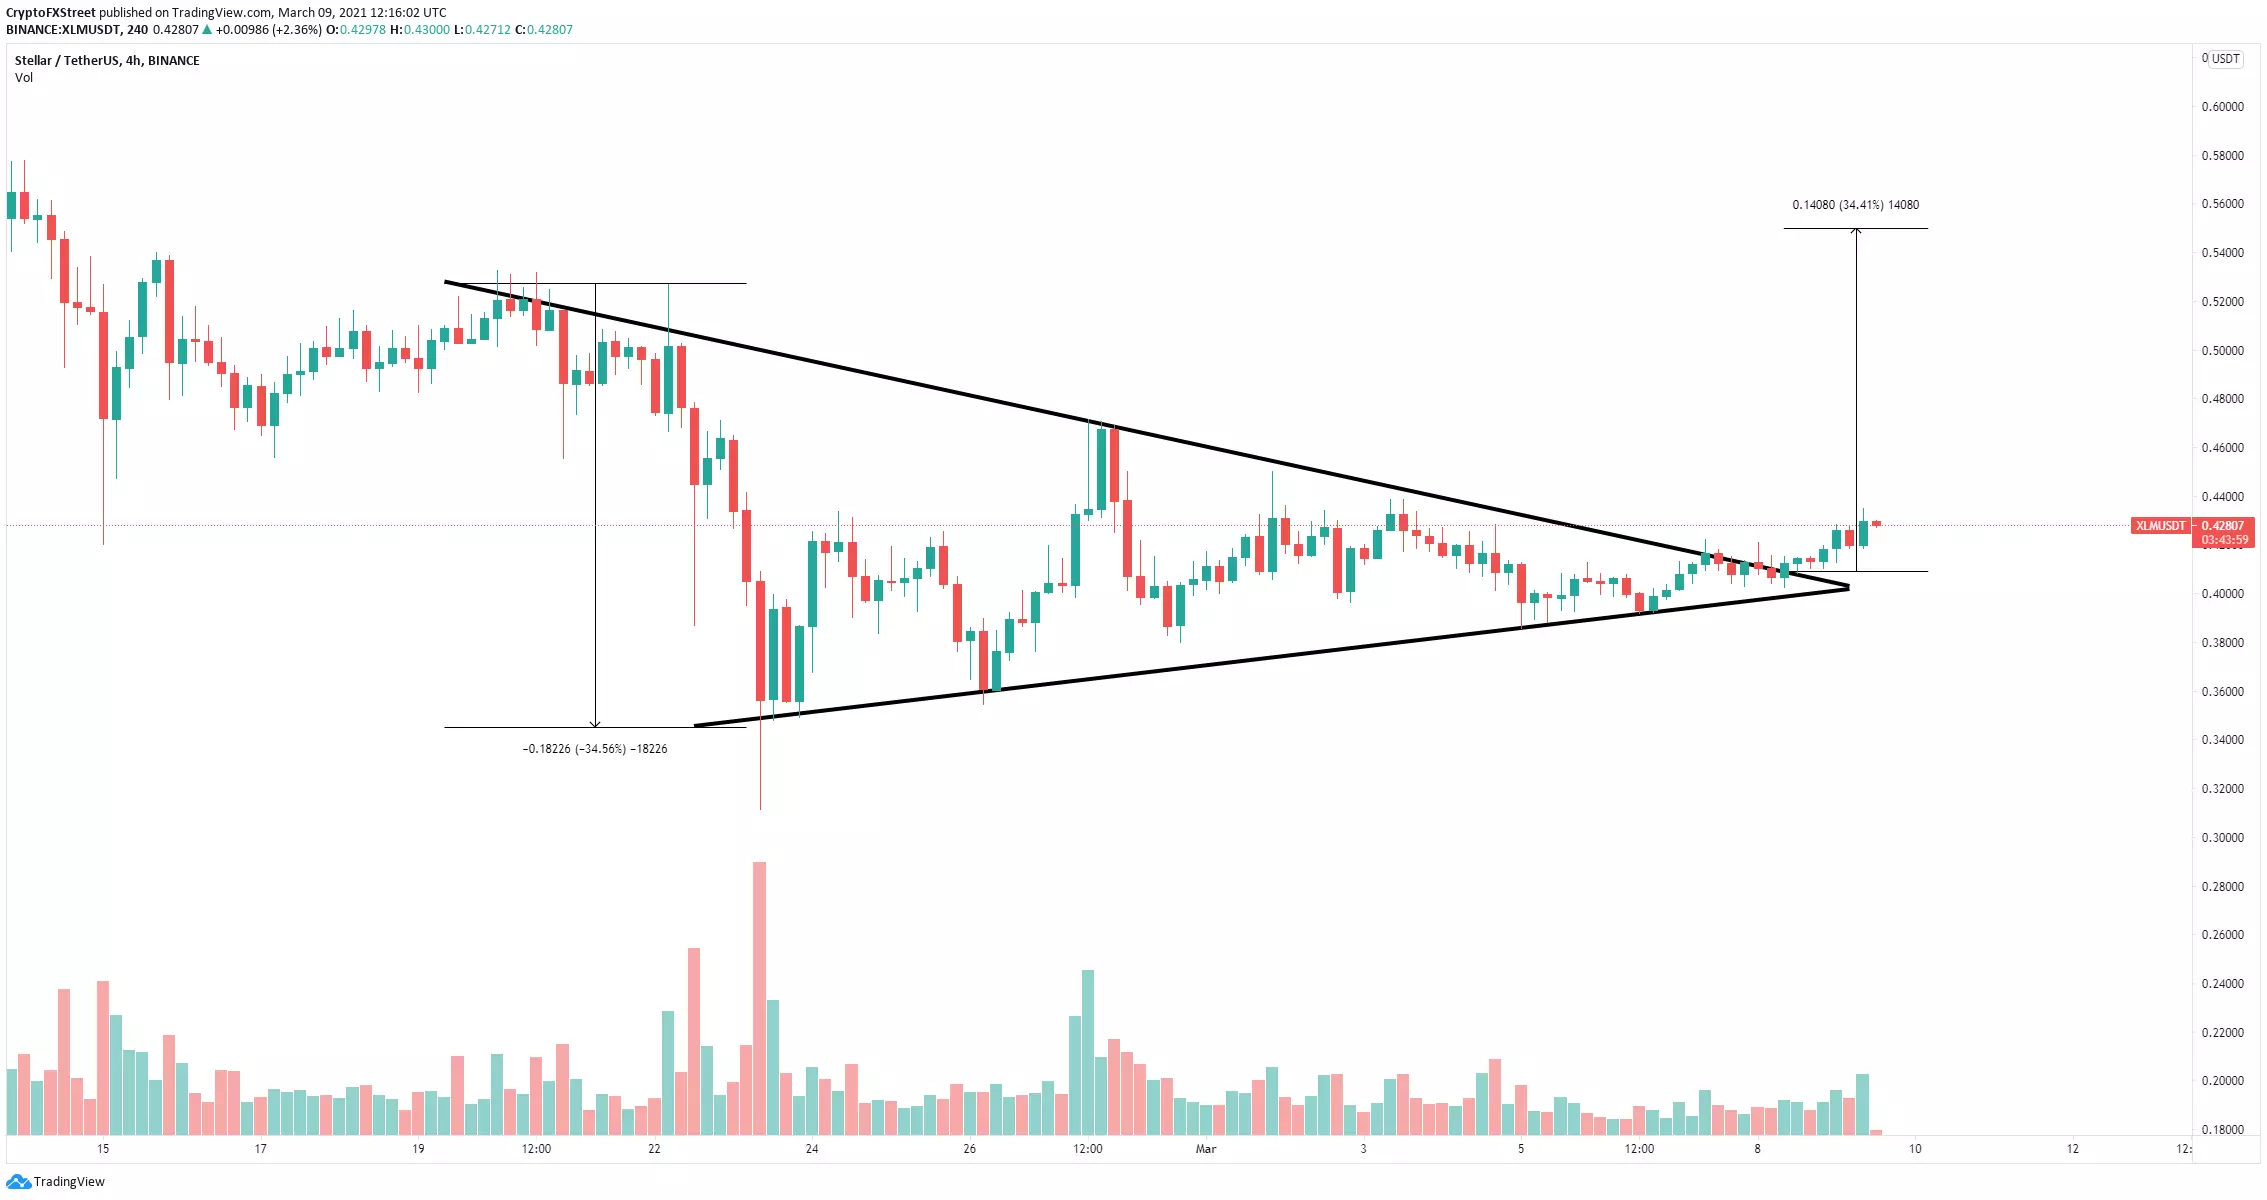
XLM/USD 4-hour chart
However, the most concerning factor is that the TD Sequential indicator has presented two green ‘8’ candlesticks on the 4-hour and 9-hour charts. These are not sell signals just yet but could transform into them soon.
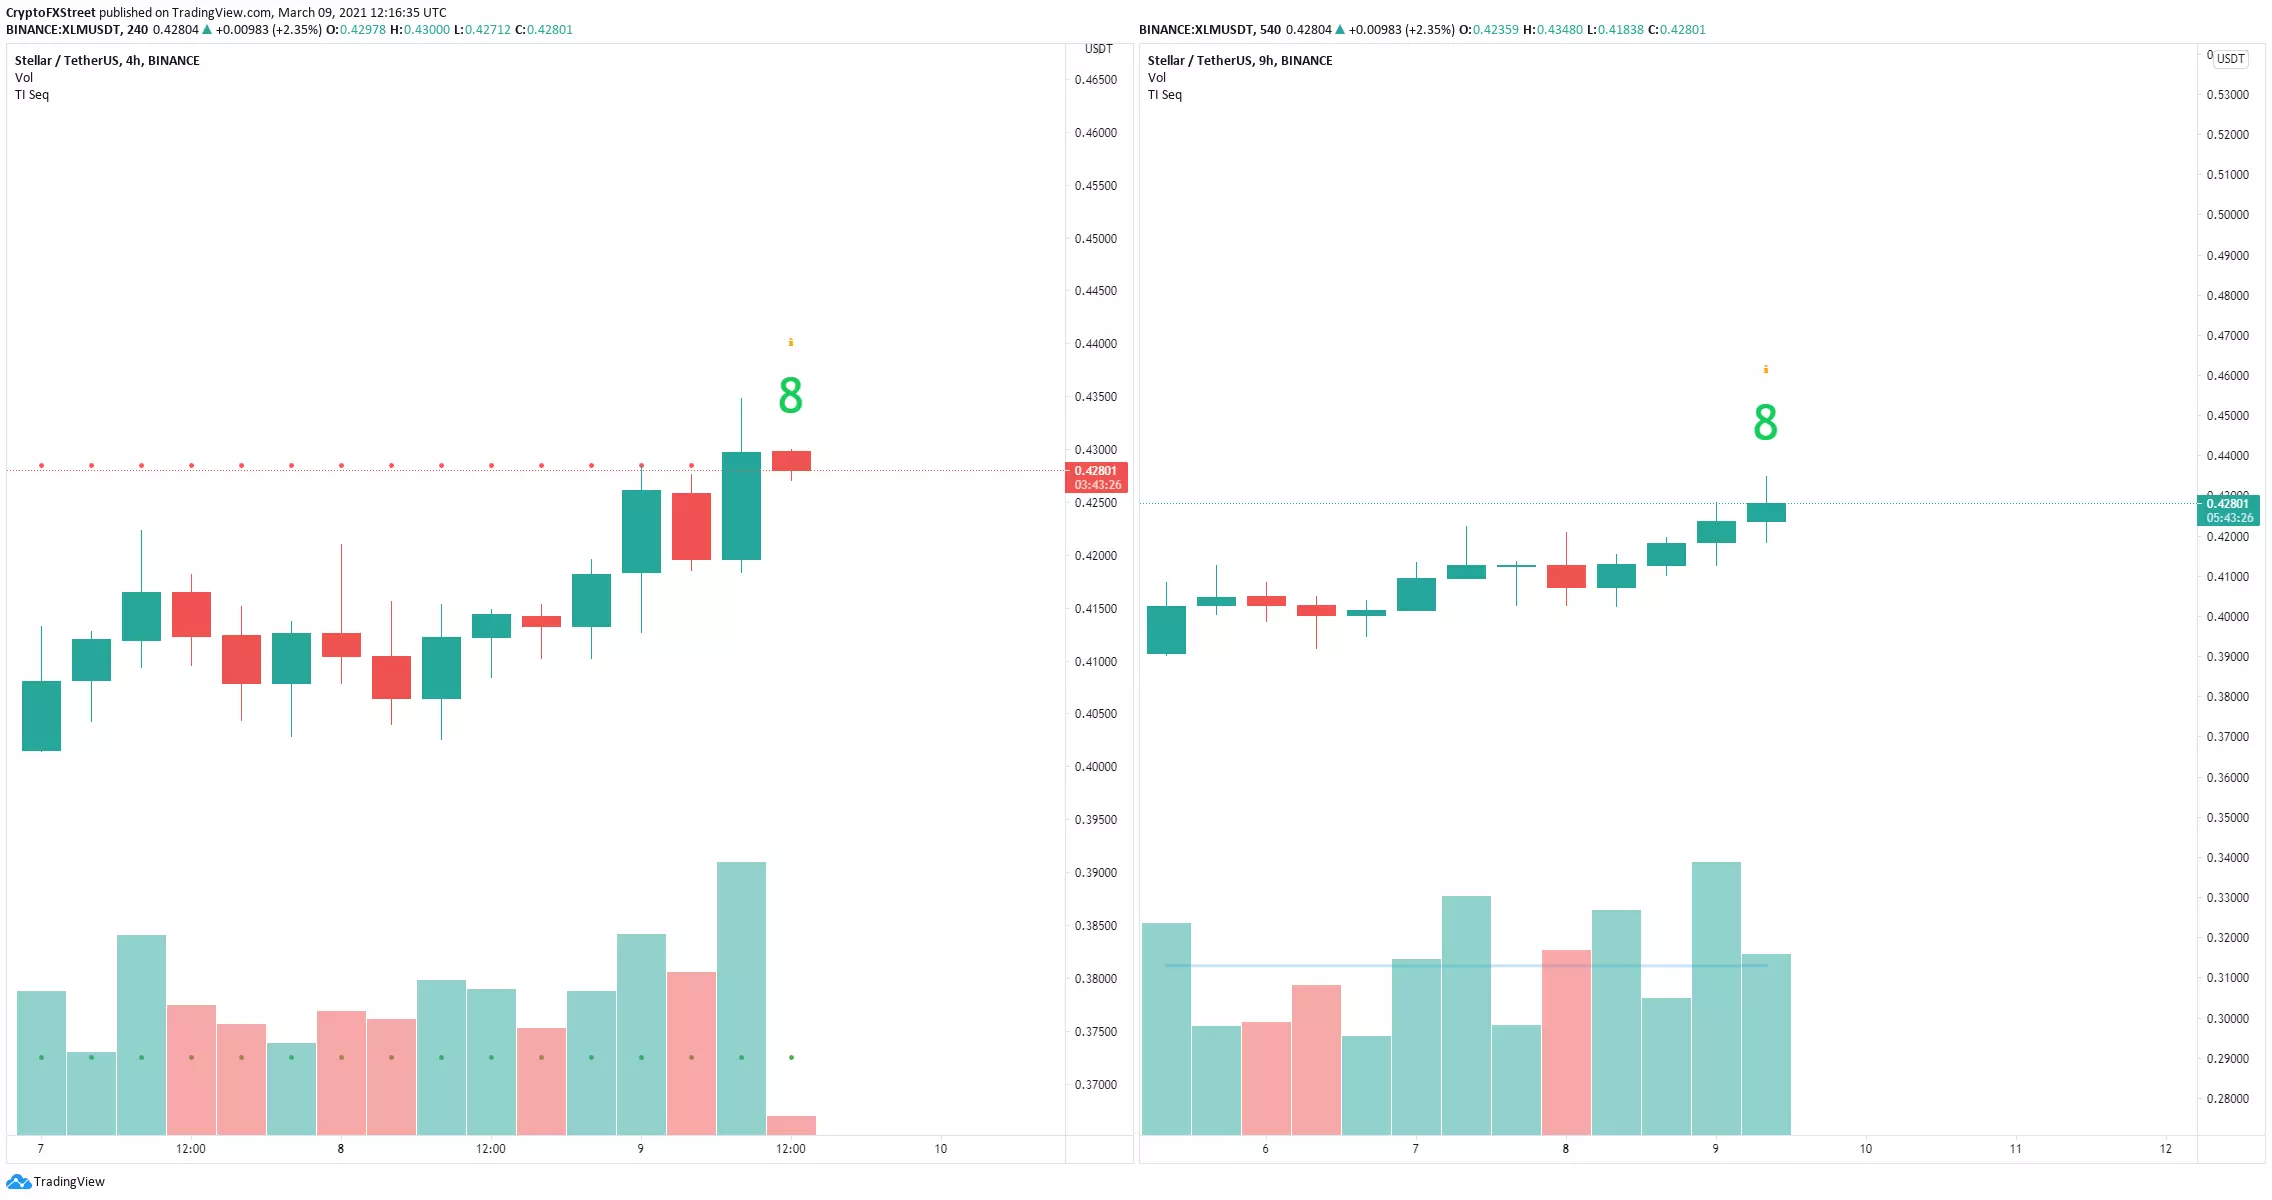
XLM Sell Signals
The validation and confirmation of both signals will significantly increase the selling pressure for XLM which could quickly fall towards $0.4 again to at least re-test the psychological level.
Author

Lorenzo Stroe
Independent Analyst
Lorenzo is an experienced Technical Analyst and Content Writer who has been working in the cryptocurrency industry since 2012. He also has a passion for trading.


