Why the Shiba Inu price suddenly seems so bearish
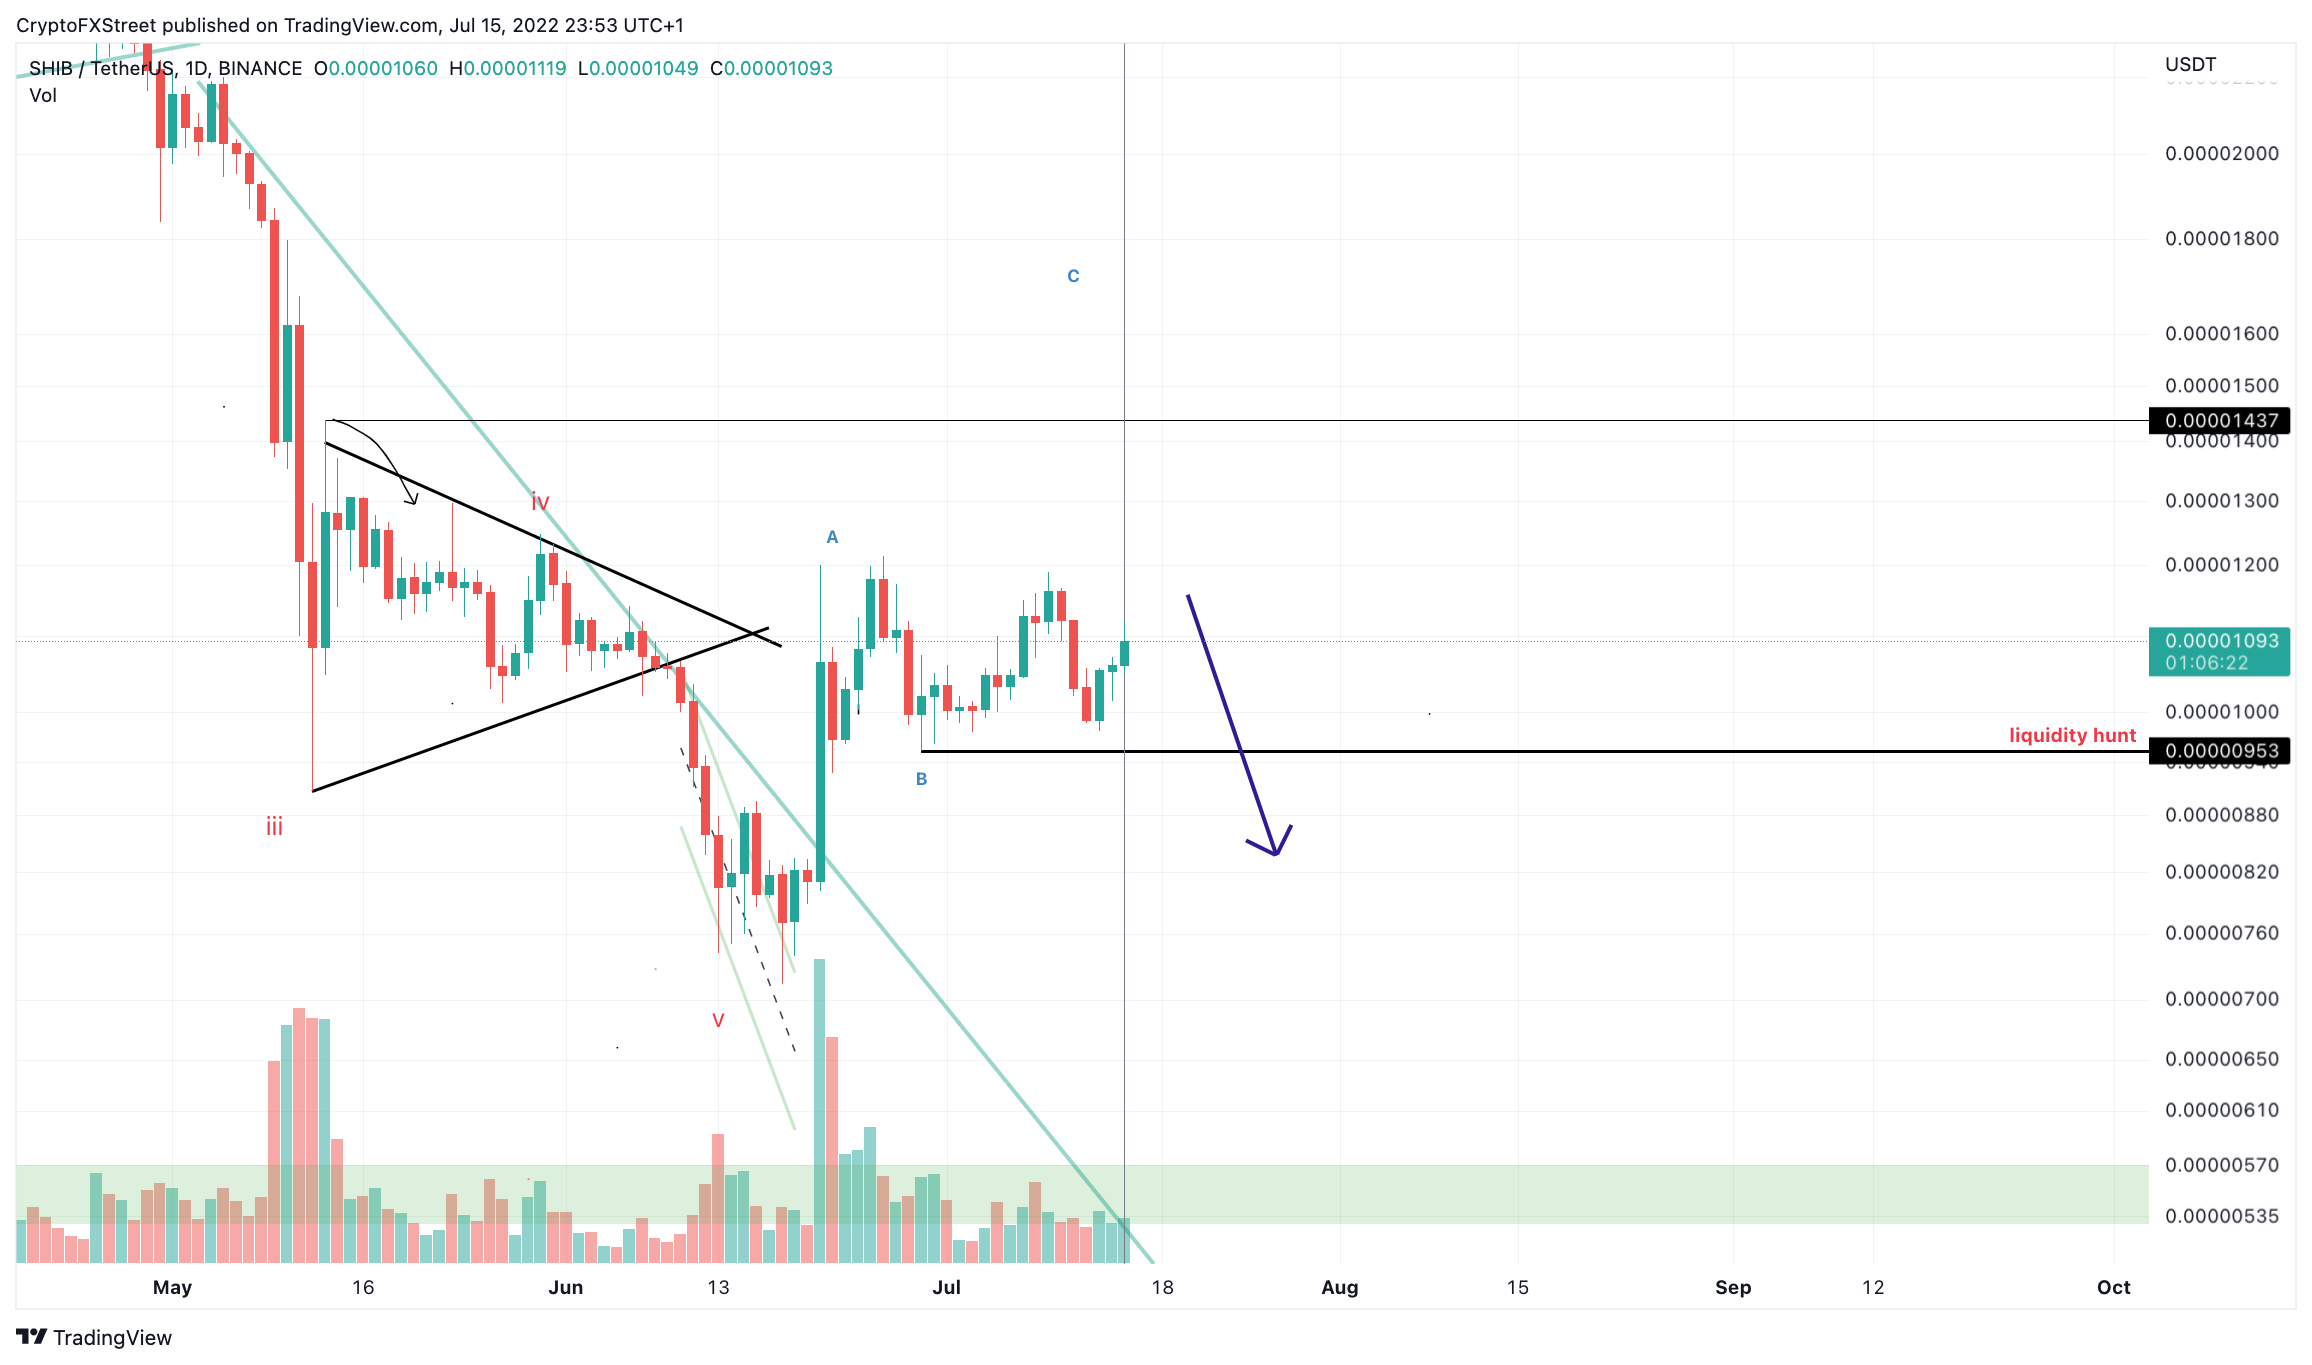
- Shiba Inu price shows the possibility for a sell-off targeting the June 21 gap at $0.00000800.
- SHIBA price triangular consolidation begins to distort proportionately
- Invalidation of the downtrend is a breach of $0.00001250.
Shiba Inu price continued sideways price action merits a second guess in further up trend potential. A 25% decline is now on the table for the notorious meme coin.
Shiba Inu price looks like a trap
Shiba Inu price shows untrustworthy signals as the bulls are establishing a retracement since the 16% sell-off on June 9. Although it was mentioned in a previous bullish outlook that a triangle breakout could propel the SHIBA price an additional 60% higher, it appears the triangle may very well be a smart money trap meant to entice traders to open losing positions. Traders may want to consider taking a slight loss/breaking even as the bears could re-route south towards the June 21 gap at $0.00000800 for a 25% decline.
Shiba Inu price currently trades at $0.00001088. What may at first glance seem like the beginning of an imminent rally for bulls, the technicals are contrarily setting up for a classical retest of the breached triangle apex near the $0.000001100 price zone. Placing an early enftry is ill-advised as the sells signal is not apparent during writing. Throughout the weekend, traders should look for bearish divergence on smaller time frames near the current price zone, or a more conservative approach would be to wait for a breach of $0.00001000 for entry.
SHIB/USDT/ 1-Day Chart
Invalidation of the bear trend is a breach above $0.00001250. If the bulls can conquer this level, they may be able to continue using the uptrend towards $0.00001400, resulting in a 30% increase from the current Shiba Inu price.
Author

Tony M.
FXStreet Contributor
Tony Montpeirous began investing in cryptocurrencies in 2017. His trading style incorporates Elliot Wave, Auction Market Theory, Fibonacci and price action as the cornerstone of his technical analysis.


