Here's why traders can't stop looking at the Shiba Inu price
- Shiba Inu price has breached the consolidative triangle and is poised to go higher.
- SHIB price shows increasing buyers' momentum on the Volume Profile Indicator.
- Invalidation of the bullish outlook remains below $0.00000925.
Shiba Inu price could rally an additional 50% from today’s current market value. Traders may still be hesitant but as the saying goes “If you are scared to place an entry, you are probably risking too much”.
Shiba Inu price is a justified buy
Shiba Inu price shows a textbook-like trade setup targeting the $0.00001700 zone as the bulls have breached and successfully closed above a triangular consolidation pattern on the 3-hour chart. Still, there is the possibility that the triangle is unfinished.
Shiba Inu price is undoubtedly a tricky chart. Elliot Wave traders will attest that contracting triangles can be challenging to trade. Triangles are notorious for trapping investors' opportunity costs and continuing in mundane-sideways price action. Just when you think you have spotted a breakout, the breakout consolidates, and you have to sit on the sidelines with a losing position.
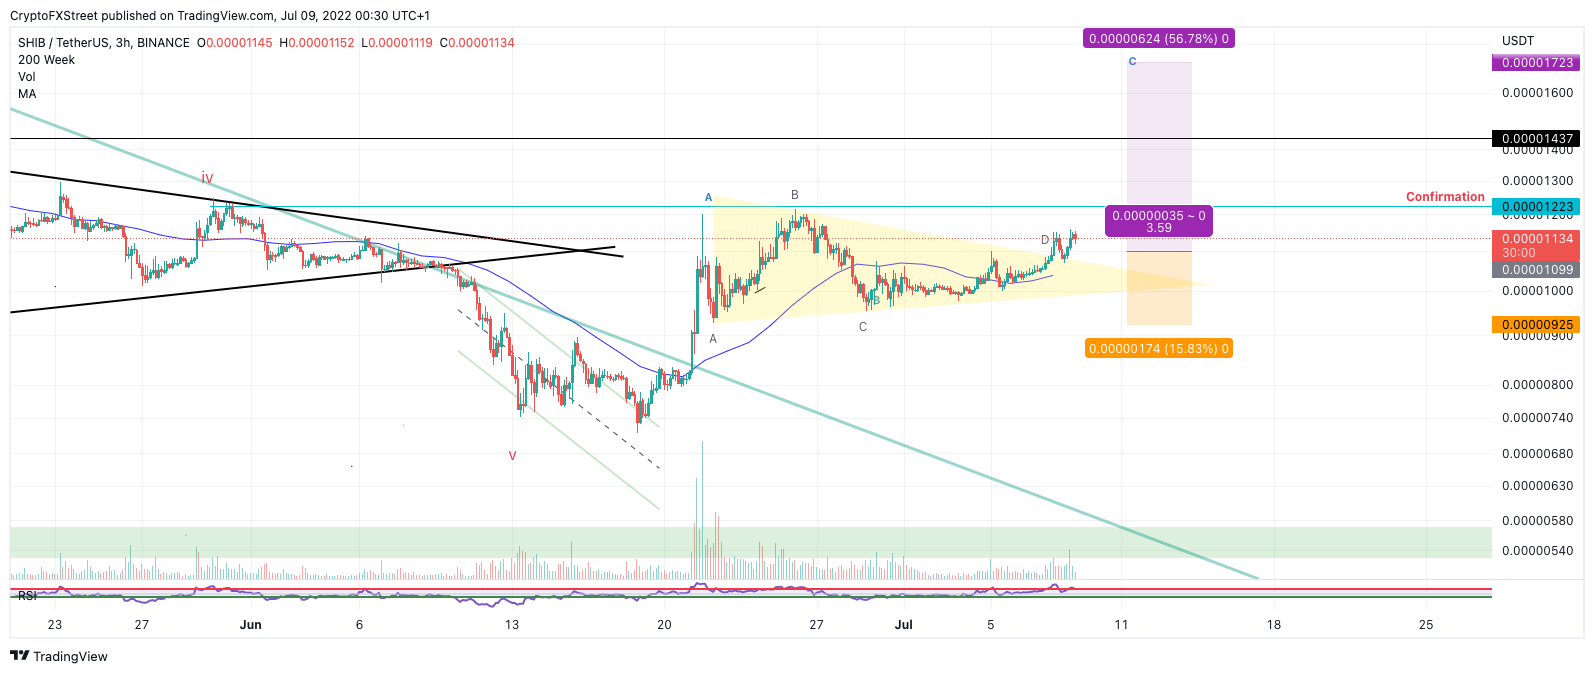
SHIB/USDT 3-Hour Chart
Still, being to hesitant with a triangle breakout also result in missed oppurtunities as triangle breakouts can become very volatile upon lift-off. Thus placing an entry at the current SHIB price of $0.00001138 is justifiable. SHIB price could impulsively rally an additional 50% in the coming days, and no one wants to miss a move like that.
World Renowned Elliot Wave practitioner Constance Brown once said that "placing an invalidation below Wave A of a triangle is a safer bet" Doing so will save traders from hours of analysis paralysis, questioning whether or not to enter the market. Instead, traders can hope these bullish signals witnessed for the Shiba Inu price are genuine and take a conservative risk. “
"If you are scared to place an entry, you are probably risking too much”. - A wise trader
Invalidation of the bullish thesis is Wave A at $0.00000925. If the $0.00000925 level is breached, the trade setup will be an honorable loss. The bears will likely take control and target $0.00000800, resulting in a 27% decrease from the current Shiba Inu price.
Author

Tony M.
FXStreet Contributor
Tony Montpeirous began investing in cryptocurrencies in 2017. His trading style incorporates Elliot Wave, Auction Market Theory, Fibonacci and price action as the cornerstone of his technical analysis.


