Why Terra’s LUNA is bound to face a technical punishment
- Terra price action has formed a medium-term bearish Japanse candlestick pattern.
- LUNA price drops back in search of support.
- Expect a drop back to $0.000112 before support kicks in.

Terra (LUNA) price action is facing headwinds from both sides as a technical candlestick pattern is throwing a spanner in the works, together with that long-feared dollar strength that is re-emerging after several warnings from Fed officials towards the markets and as most of the dollar weakness got erased in the final trading hours on Friday. These two elements show the weak spot for Terra price action as we advance and look set to drop in search of support towards $0.000112 near the 78.6% Fibonacci level. At risk is even a full swing back towards sub $0.000100.
LUNA price is no match for two headwinds
First, Terra price action reveals daily a ‘Grave Stone Doji’ from Wednesday and Thursday. Characteristics are that first, there is a big bullish candle like the one on Wednesday after the lower CPI print, followed the next day by an inverted hammer, but with no wick at the bottom. What follows is often a sell-off of multiple days until at least below the low of the price action from Wednesday. Translated, that would mean a drop of a minimal 4% is granted in search of support near the 61.8% Fibonacci level at $0.000107.
LUNA price next could tumble again as the dollar strength kicks in again on Friday, the University of Michigan revealed that inflation expectations are still higher, meaning that the Fed will continue to hike, and thus the dollar outweighs several cryptocurrencies in that equation. This could be the catalyst that pushed LUNA below the green ascending trend line and dropped 20% towards $0.000095 at the 23.6% Fibonacci level. With this move, all of the incurred gains for July and the summer have evaporated.
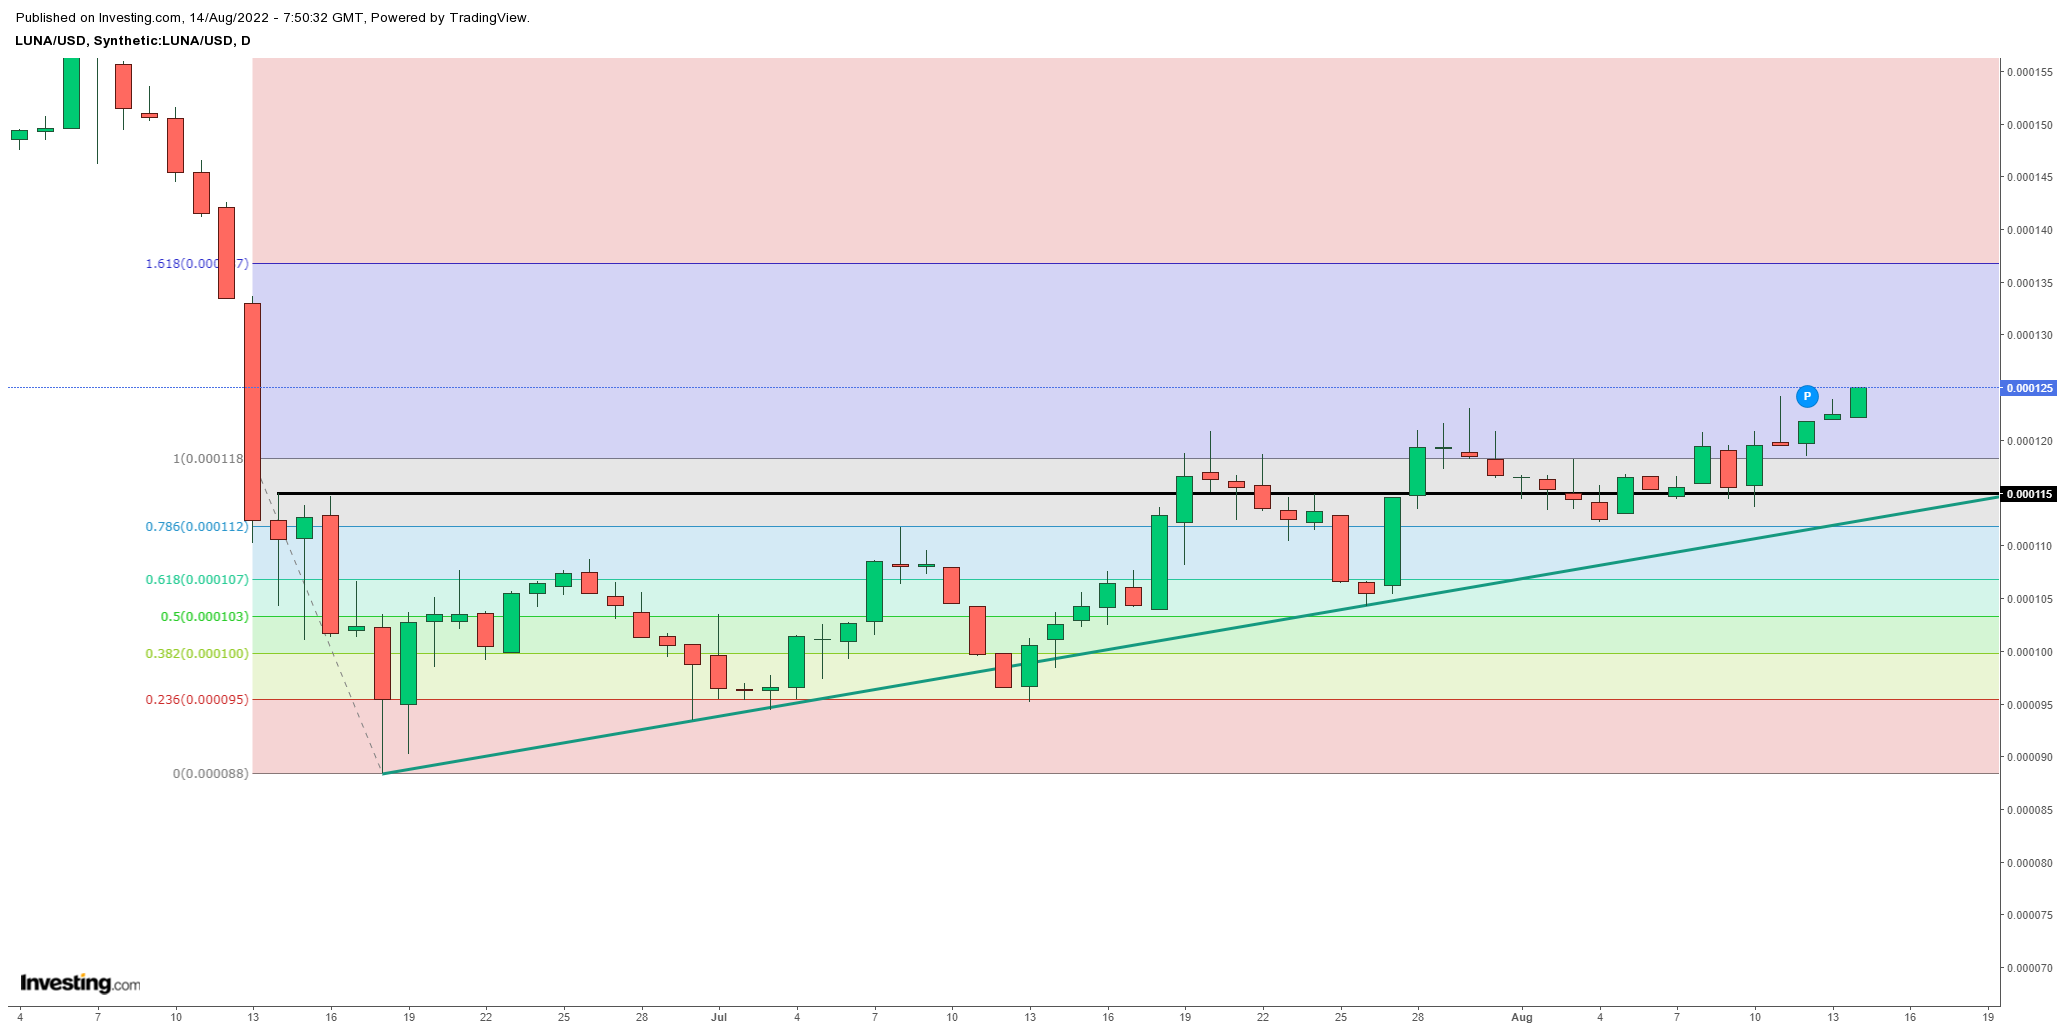
LUNA/USD Weekly chart
An upside surprise could come from some easing tensions out of Ukraine, positive headlines around supply chain issues getting resolved or more drops in inflation. Any one of those helped with a weaker dollar would bring LUNA price action towards $0.000137 at the 61.8% Fibonacci level to the upside. This could come with a bounce of the $0.000118 baseline in case it holds over the weekend.
Author

Filip Lagaart
FXStreet
Filip Lagaart is a former sales/trader with over 15 years of financial markets expertise under its belt.



